Instantly Turn Your Collected Data into Custom PDF Reports in the Field
canlı casino siteleri online casino rottbet giriş rott bet güncel giriş
A fully customized reporting and analysis platform built for your wireless measurement workflow
Connect with MultiGage
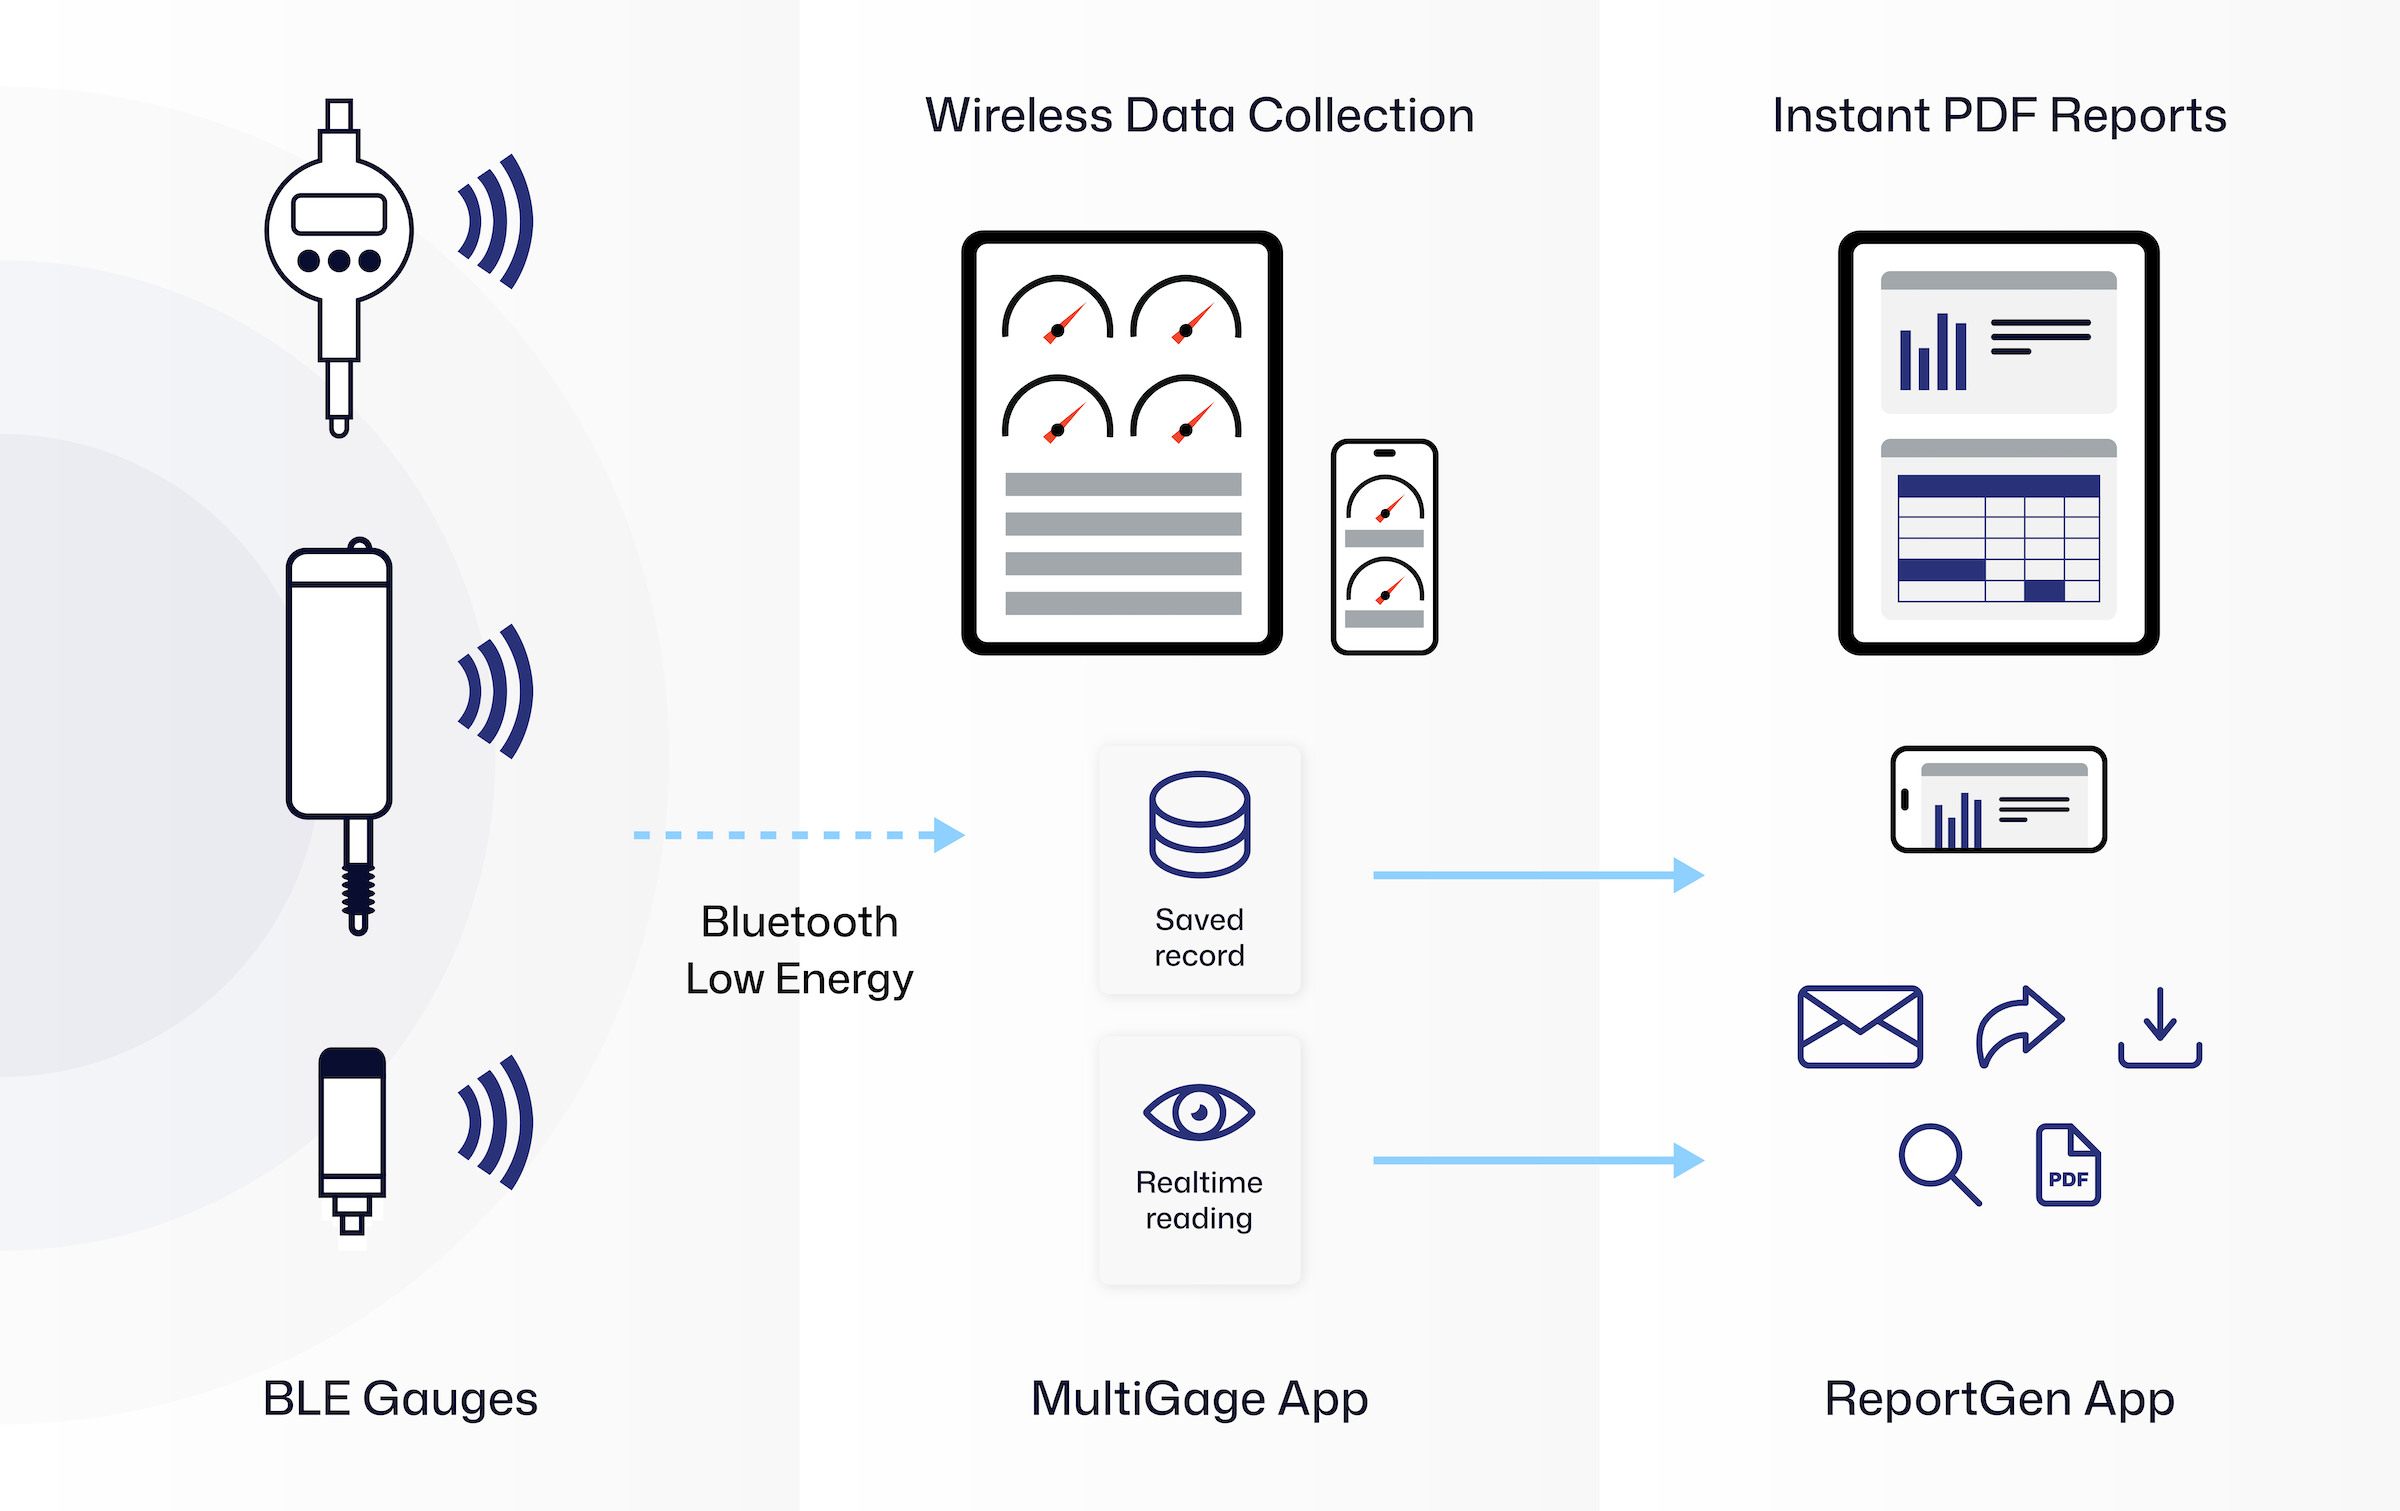
MultiGage sends wireless measurement data directly into ReportGen.
Access Custom Templates
Motionics builds templates that match your exact reporting and analysis needs.
Monitoring & Analysis
View live MultiGage readings from connected gauges or import recorded data.
Generate & Export
Generate customized reports then export and share as PDF, CSV & more.
Connect with MultiGage
MultiGage sends wireless measurement data directly into ReportGen
Access Custom Templates
Motionics builds templates that match your exact reporting and analysis needs.
Monitoring & Analysis
View live MultiGage readings from connected gauges or import recorded data.
Generate & Export
Generate customized reports then export and share as PDF, CSV & more.
Features
- Auto PDF Report generation with MultiGage App collected data
- Customizable report template for your company with your information and logo
- Option to add any report data, signature, map, location, plots, raw data, extra analysis with your data, etc.
- Can be deployed across the team in your company for better report management
- Report generation using saved collected data or real-time connected gauge readings
- Option to integrate with your cloud database such as Google Drive to bring your data into the report
- Monthly and annual subscription with single or multiple device license options
- Available for iPhone and iPad - custom Android options available. Contact for more information
Description
ReportGen is an iPad and iPhone app designed to work seamlessly with our MultiGage wireless measurement software. Built for teams that require advanced reporting or realtime data analysis, ReportGen receives measurement data directly from MultiGage and displays it through custom configured templates designed specifically for each customer. Every user logs in through a unique ID, giving them access to tailored modules built by Motionics to match their exact workflows.
ReportGen works as a companion application to MultiGage, extending its data-handling and analysis capabilities. After users collect and save measurements in MultiGage, they can export those data sets directly into ReportGen, where the information is organized for deeper analysis and professional report generation. ReportGen can also link to MultiGage in real time, allowing it to display live sensor readings and conduct data analysis. Any measurement type supported by our wireless gauges can be used including load, pressure, deflection, distance, angle, etc. ReportGen serves as both a visualization layer and a structured database for monitoring, reviewing and analyzing measurement data at any stage in the workflow.
Every ReportGen setup is fully customized. Templates can include selected data points, locations and test parameters along with visual elements such as graphs, tables and diagrams. Layout, composition and branding are also configurable to meet company standards.
Completed reports can be generated, exported and shared in PDF, CSV or any other necessary formats. This gives users a powerful reporting tool that optimizes measurement and inspection workflows.
Interested in learning more?