Description
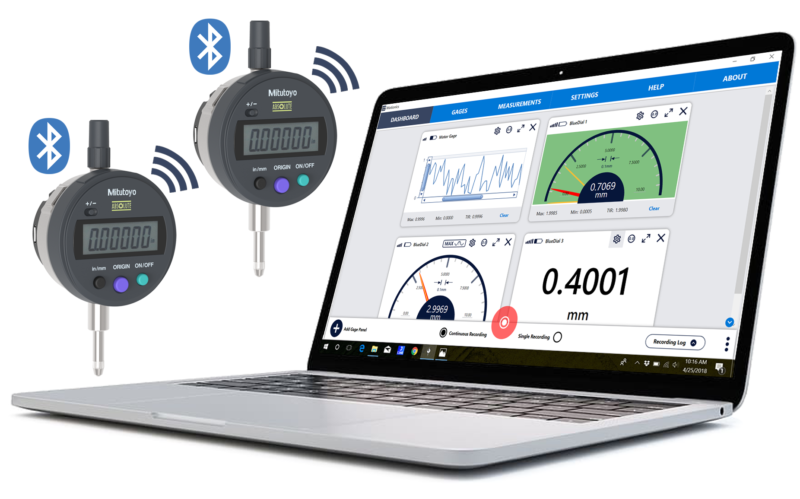
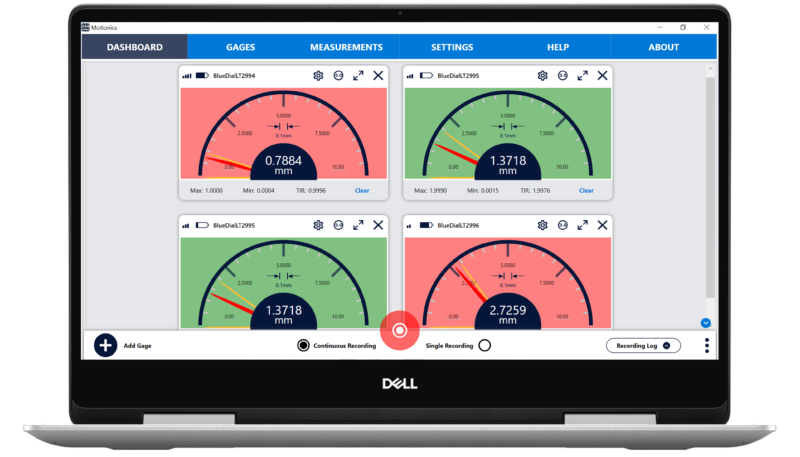
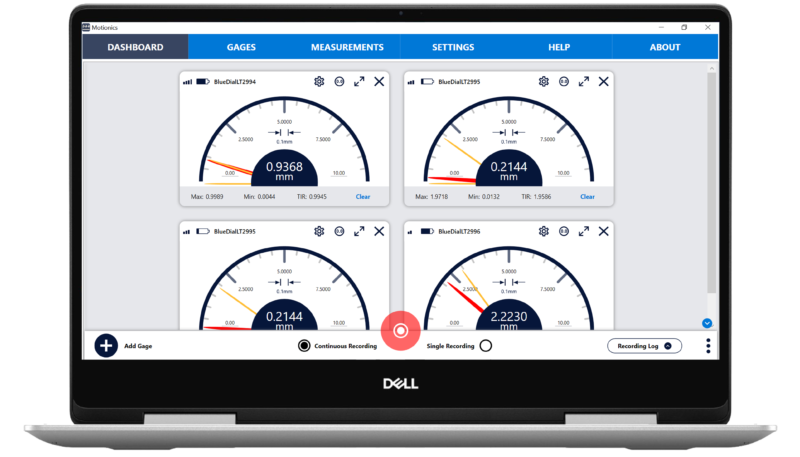
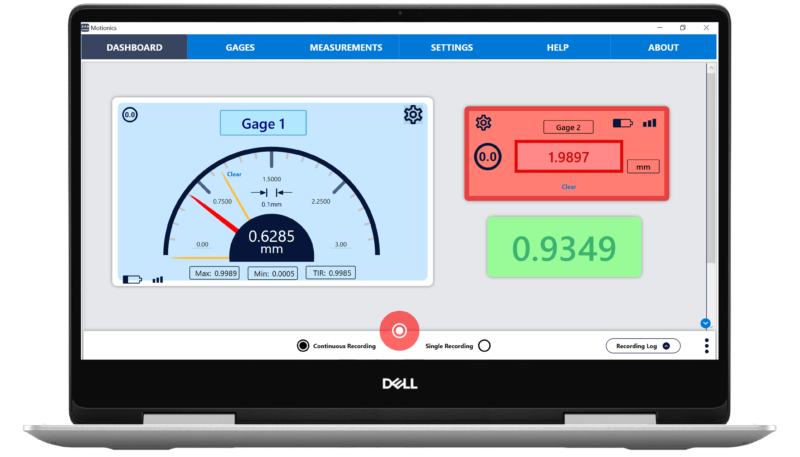
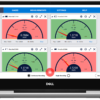
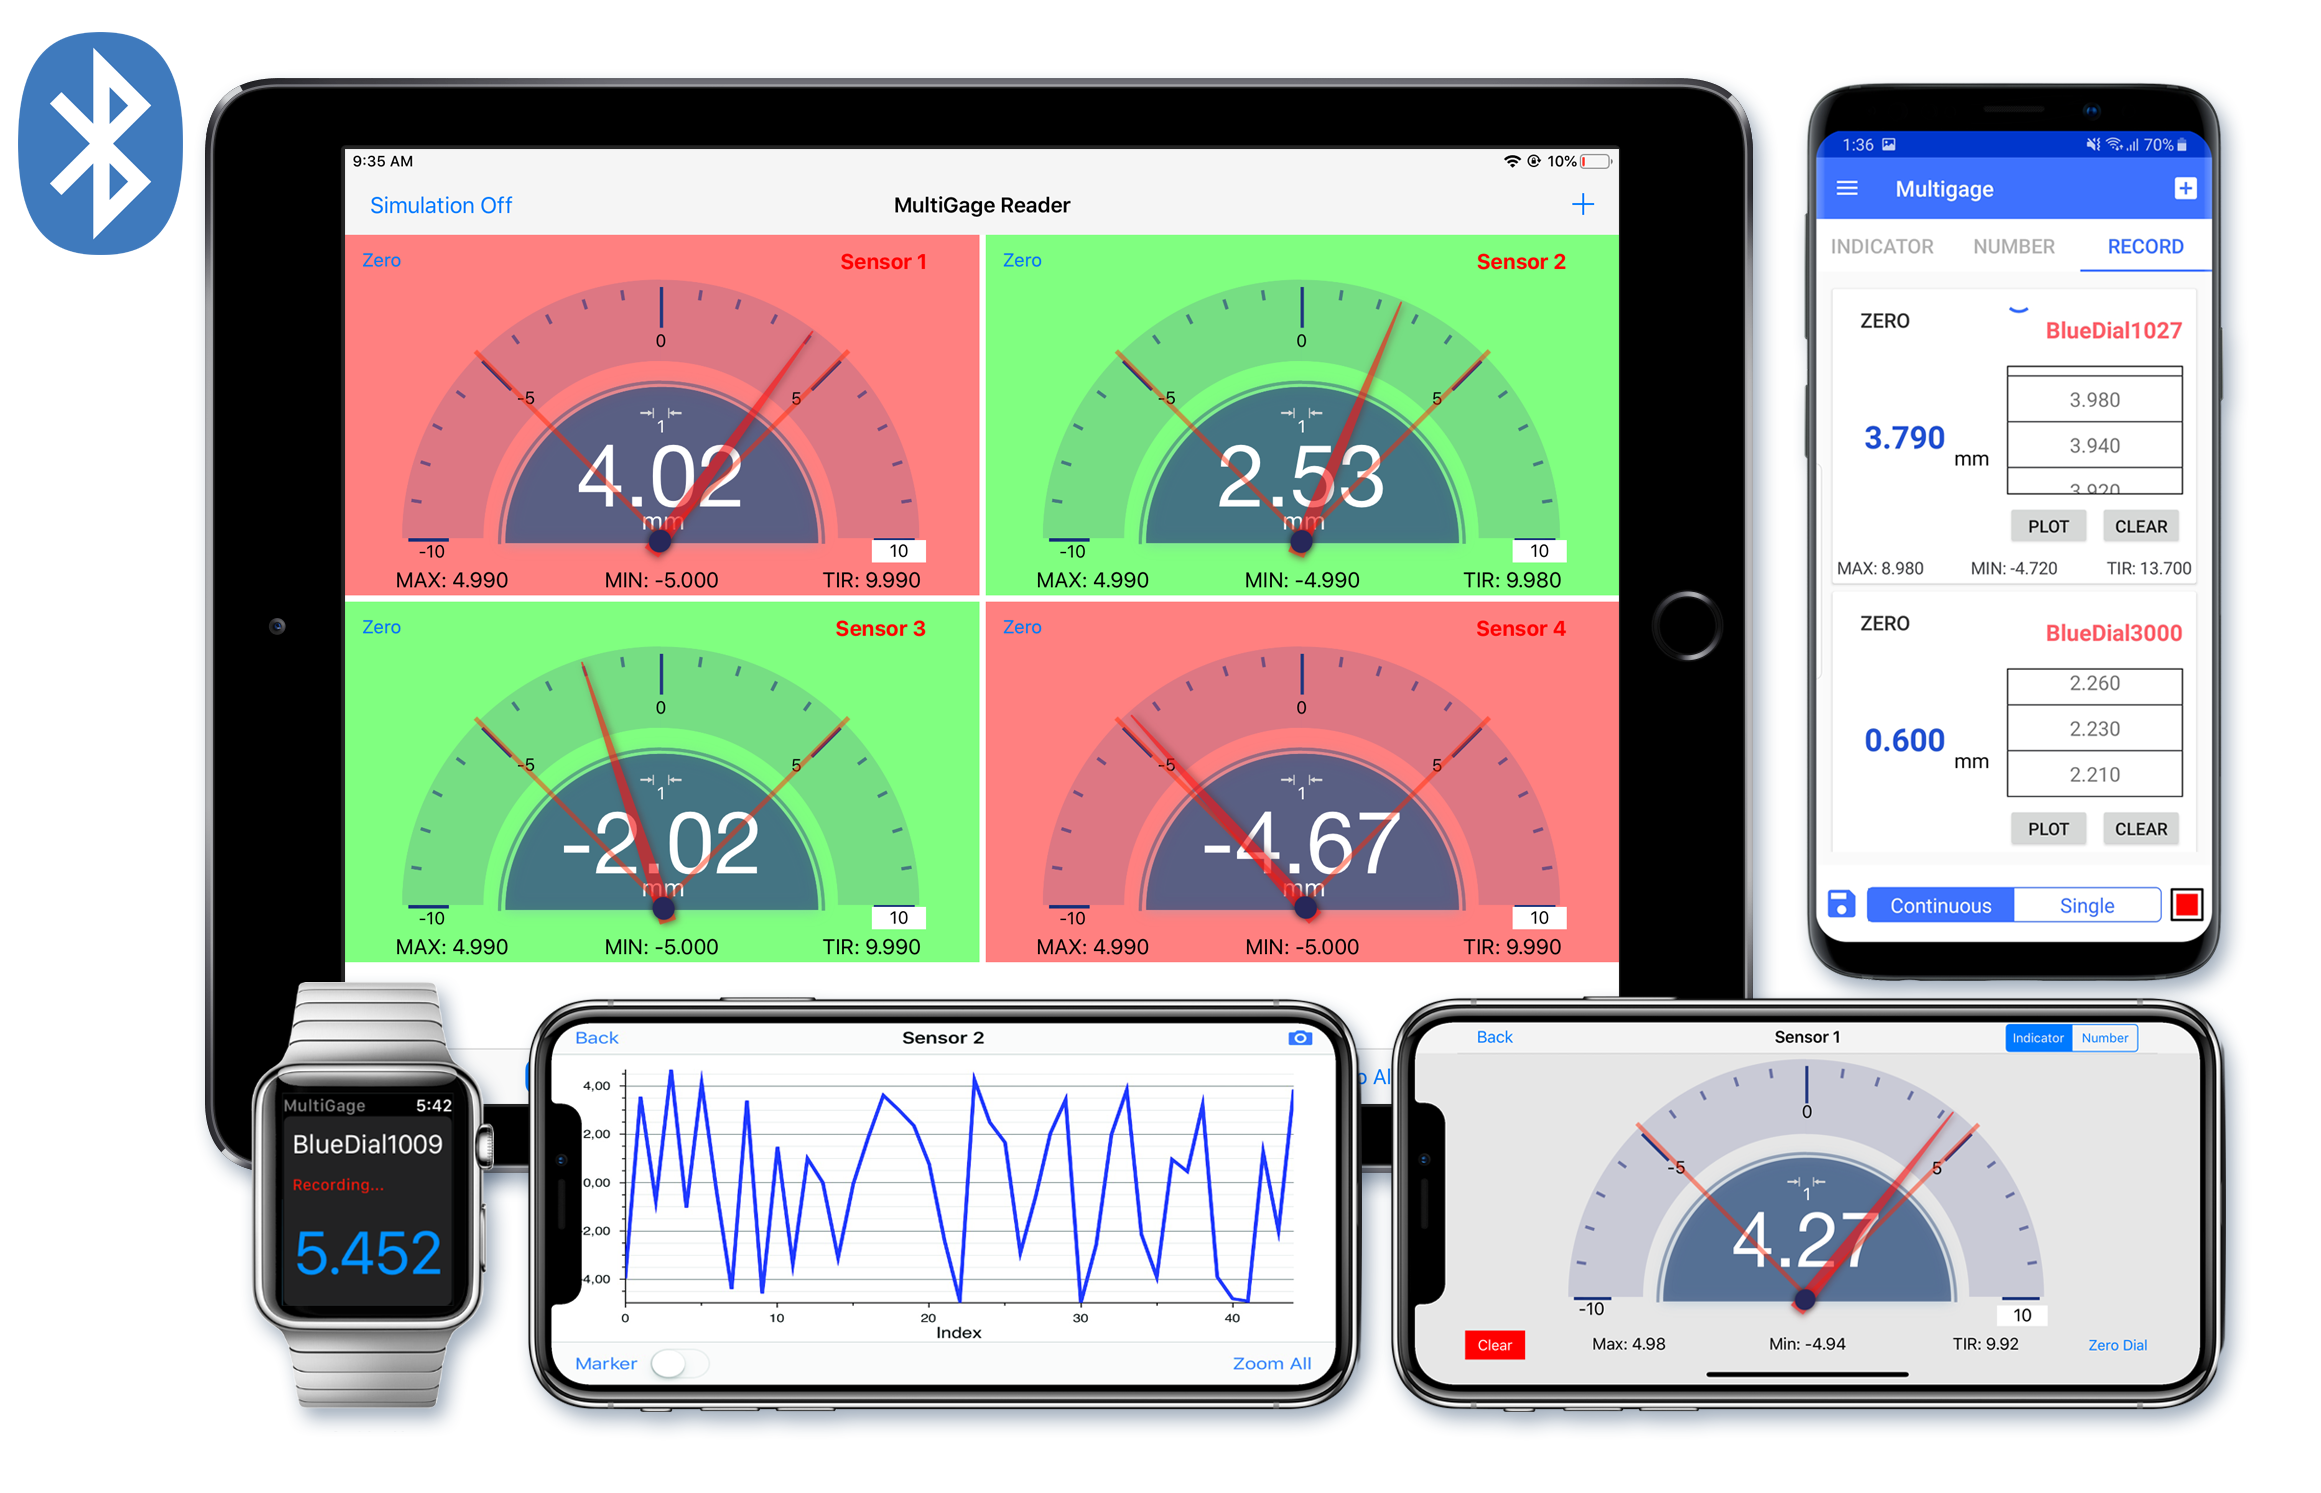
MultiGage Reader software is able to connect to multiple Motionics Bluetooth measurement devices (8 devices per dongle) and receive readings from all of them at the same time. Each device will be assigned an individual panel to display measurement reading, max, min, and TIR.
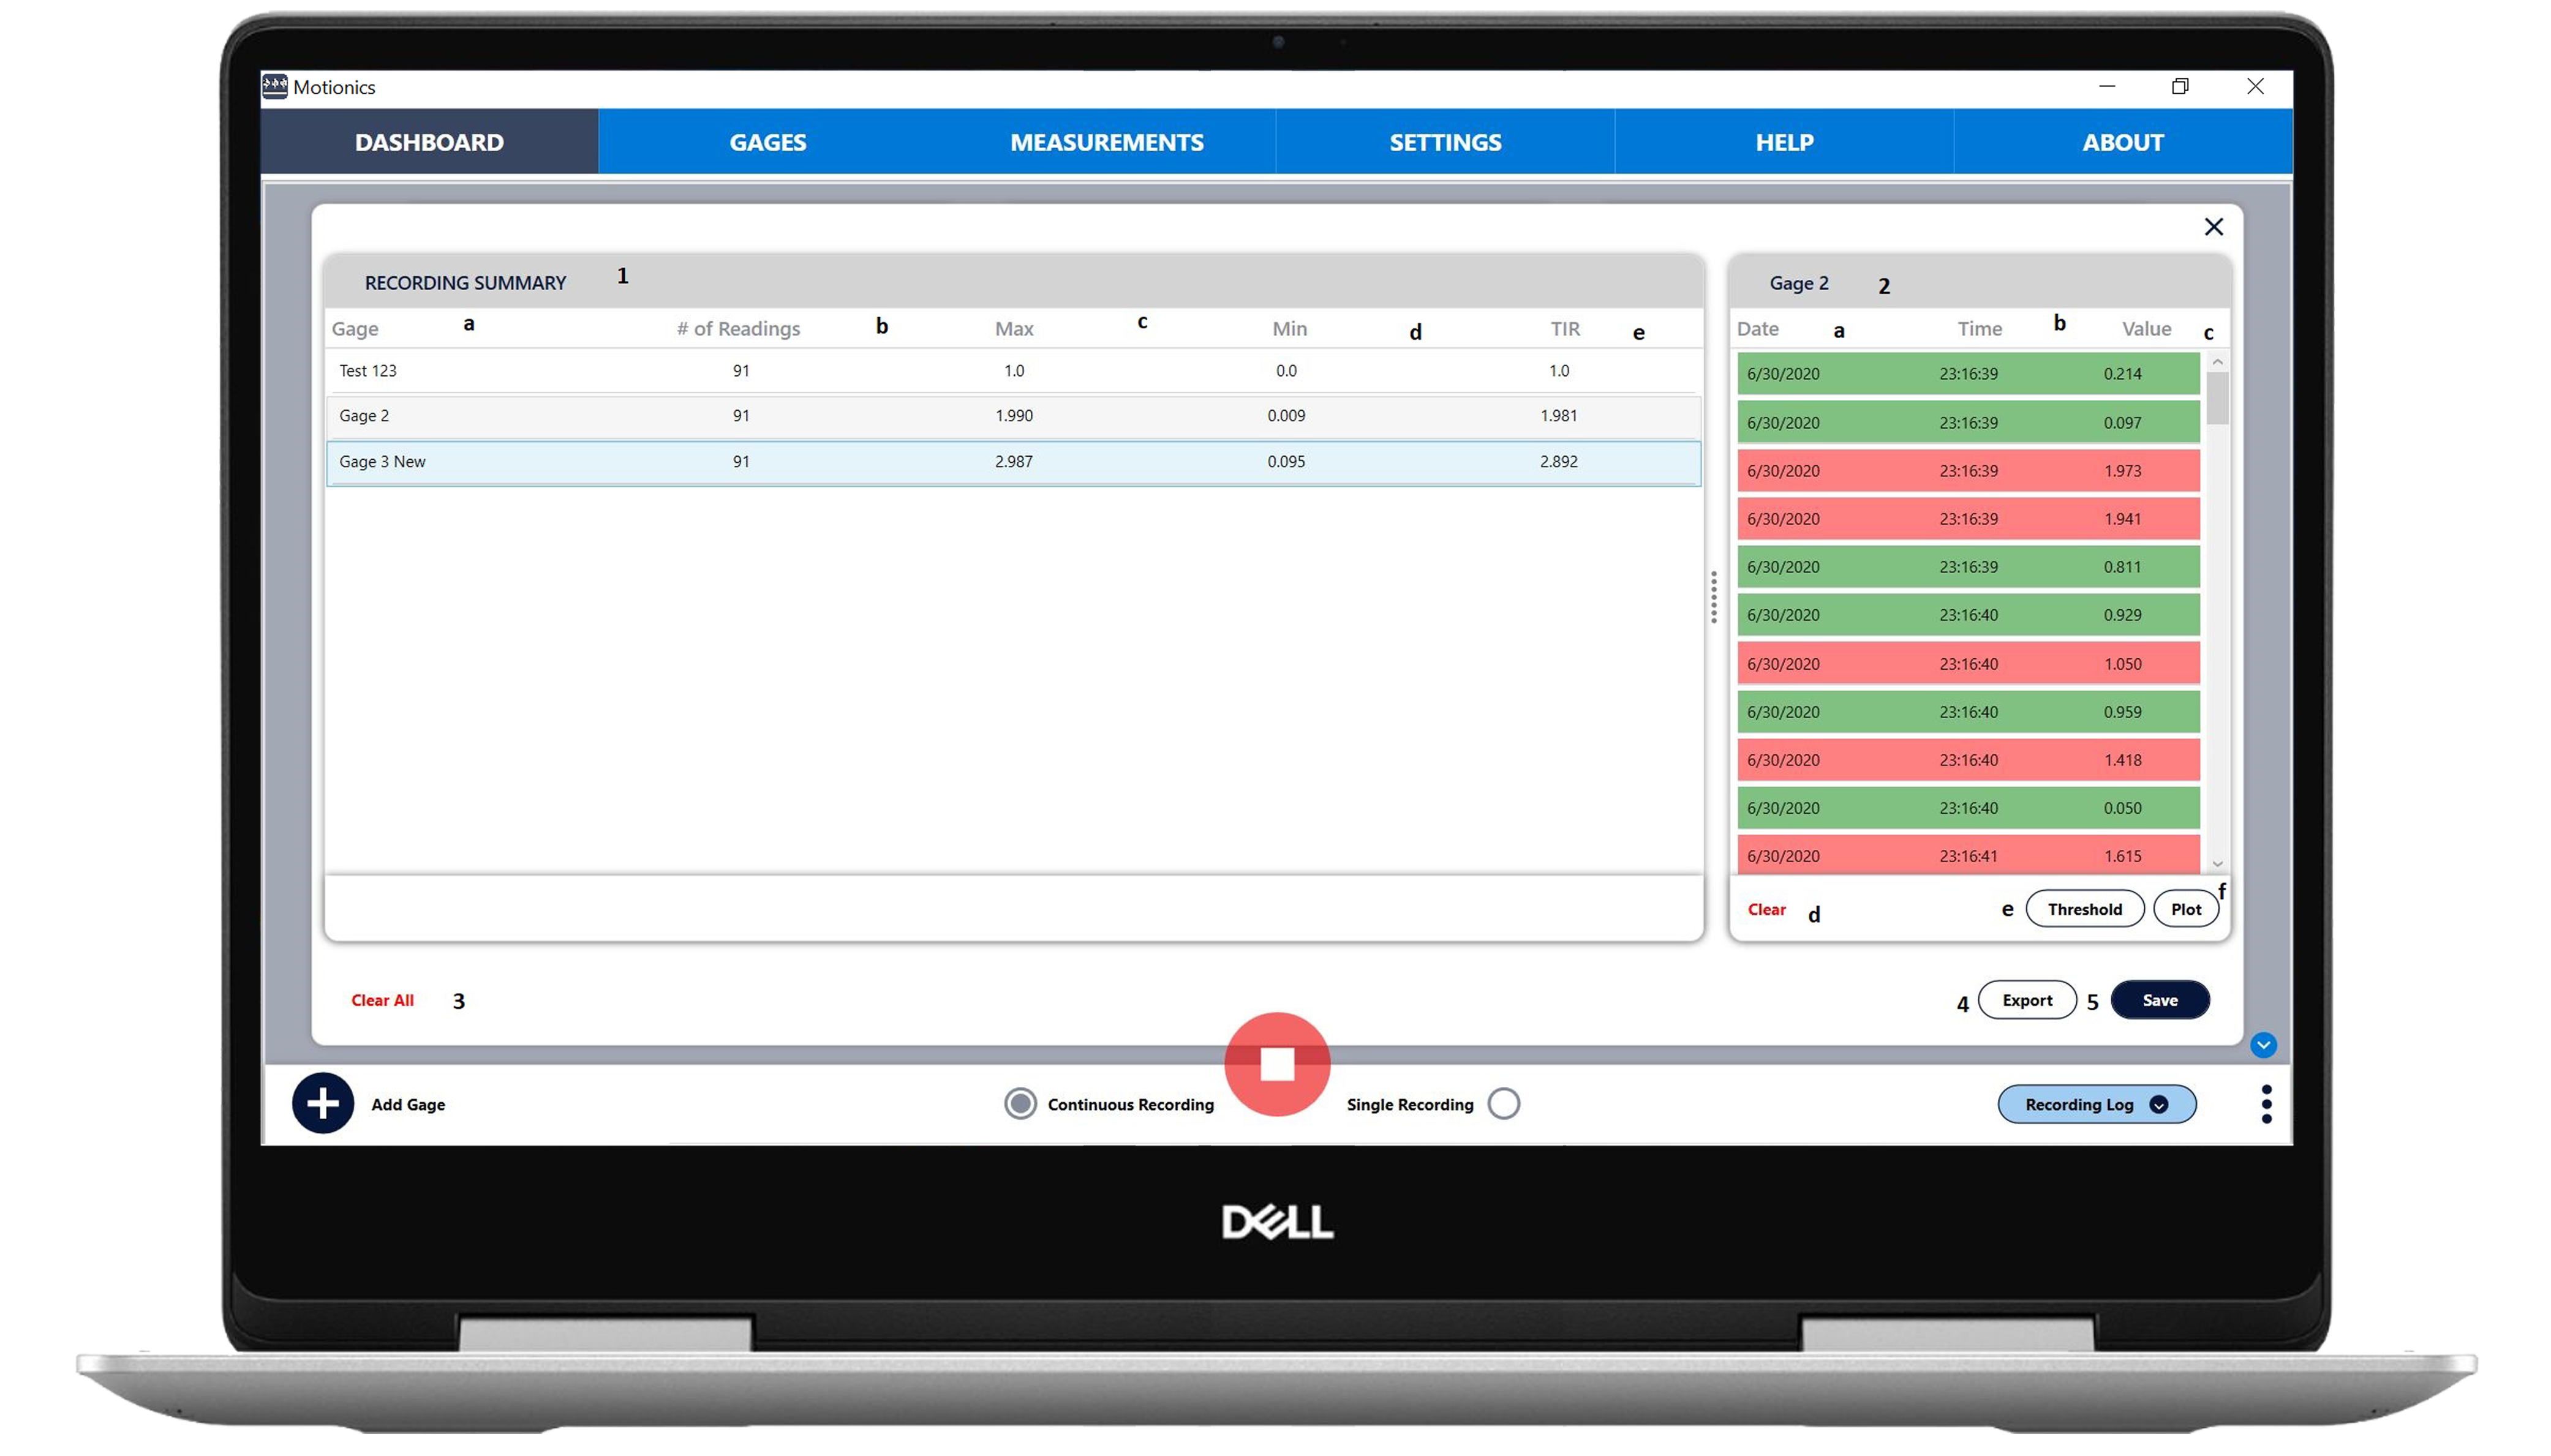
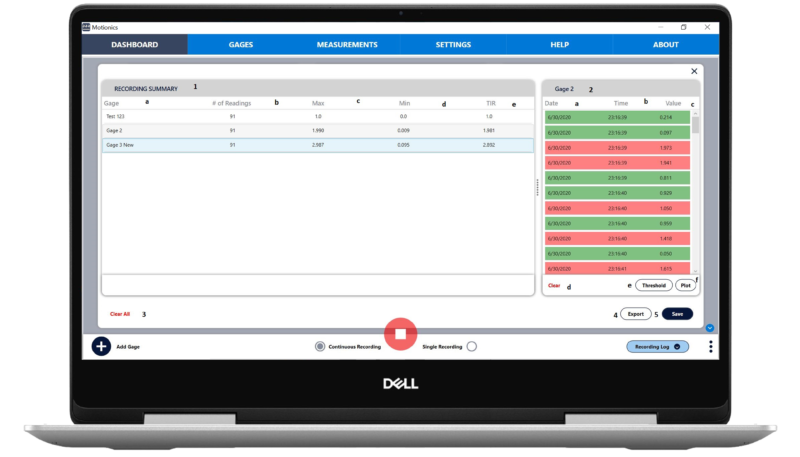
MultiGage Reader provides two options for data recording: continuous recording at up to 10 samples/sec, or one-by-one capturing through button tapping. Recorded data can be plotted in a user-interaction-enabled graph, saved in a database, and exported as a CSV file for further assessment. This software makes dimensional measurement faster and easier.
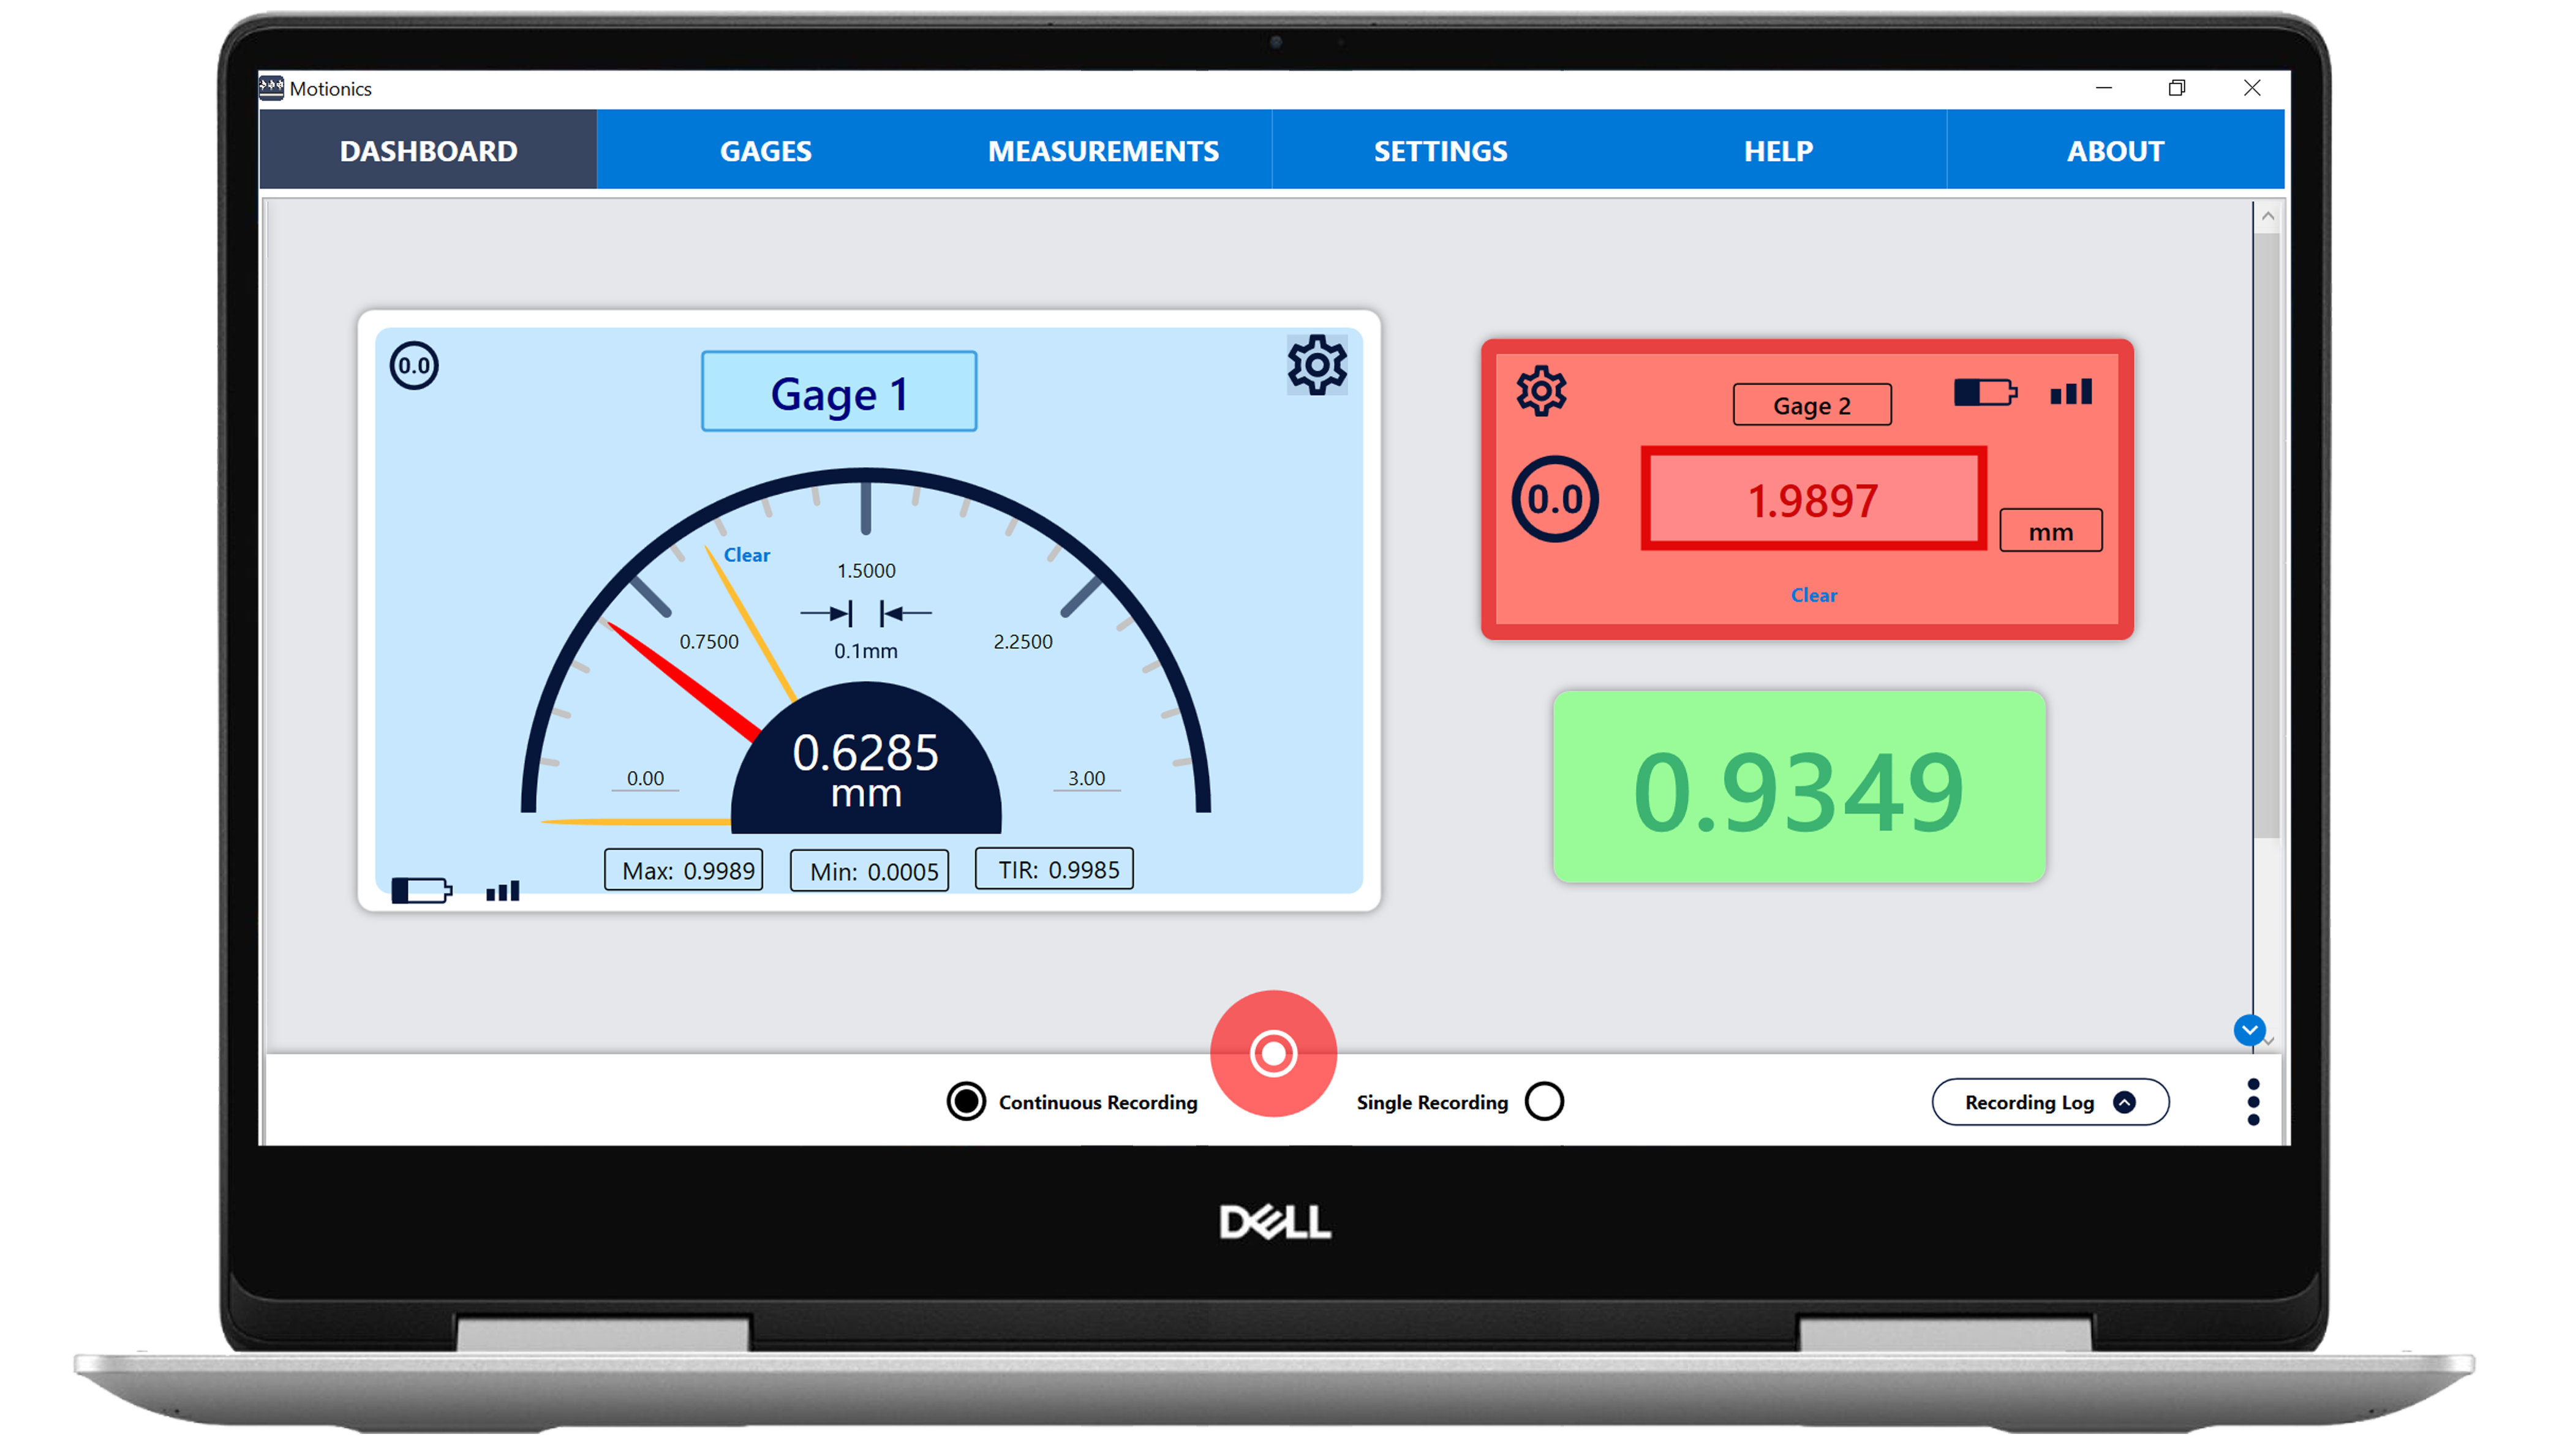
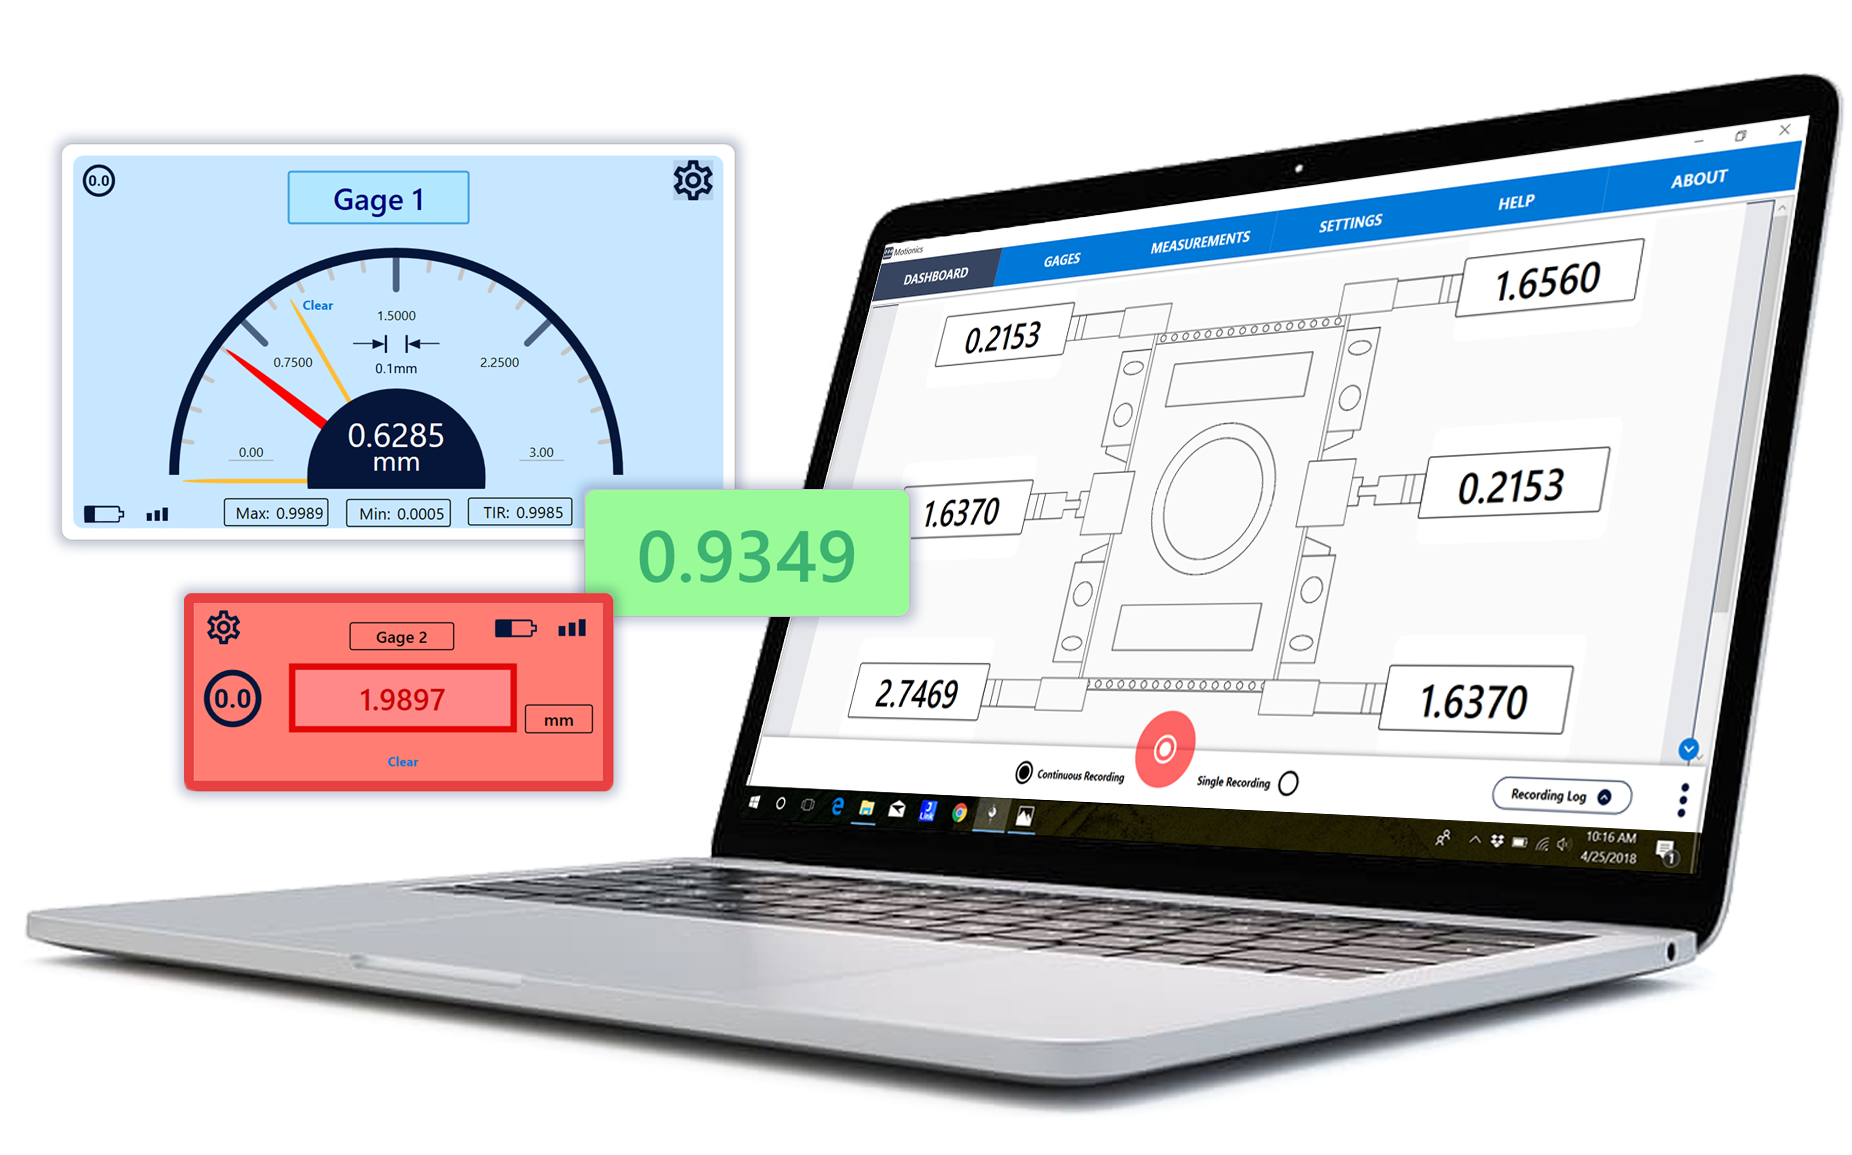
With the additional custom gauge panels feature, you can customize your dashboard even further with customizable gauge panels, panel components, and custom backgrounds.
- Simultaneous reading of multiple devices
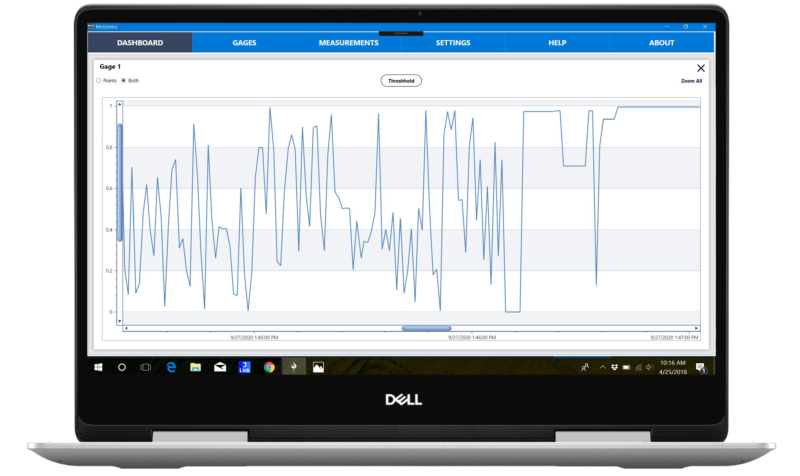
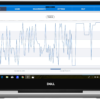
- Real-time data plotting
- Continuous or single data point recording
- Max, Min, TIR measurement
- Remote zeroing from the app
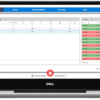
- GO/NG judgment with green/red color indication
- Customizable dashboard
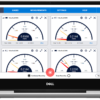
- Large analog probe meter with adjustable range
- Data saving in local database
- Data export as CSV
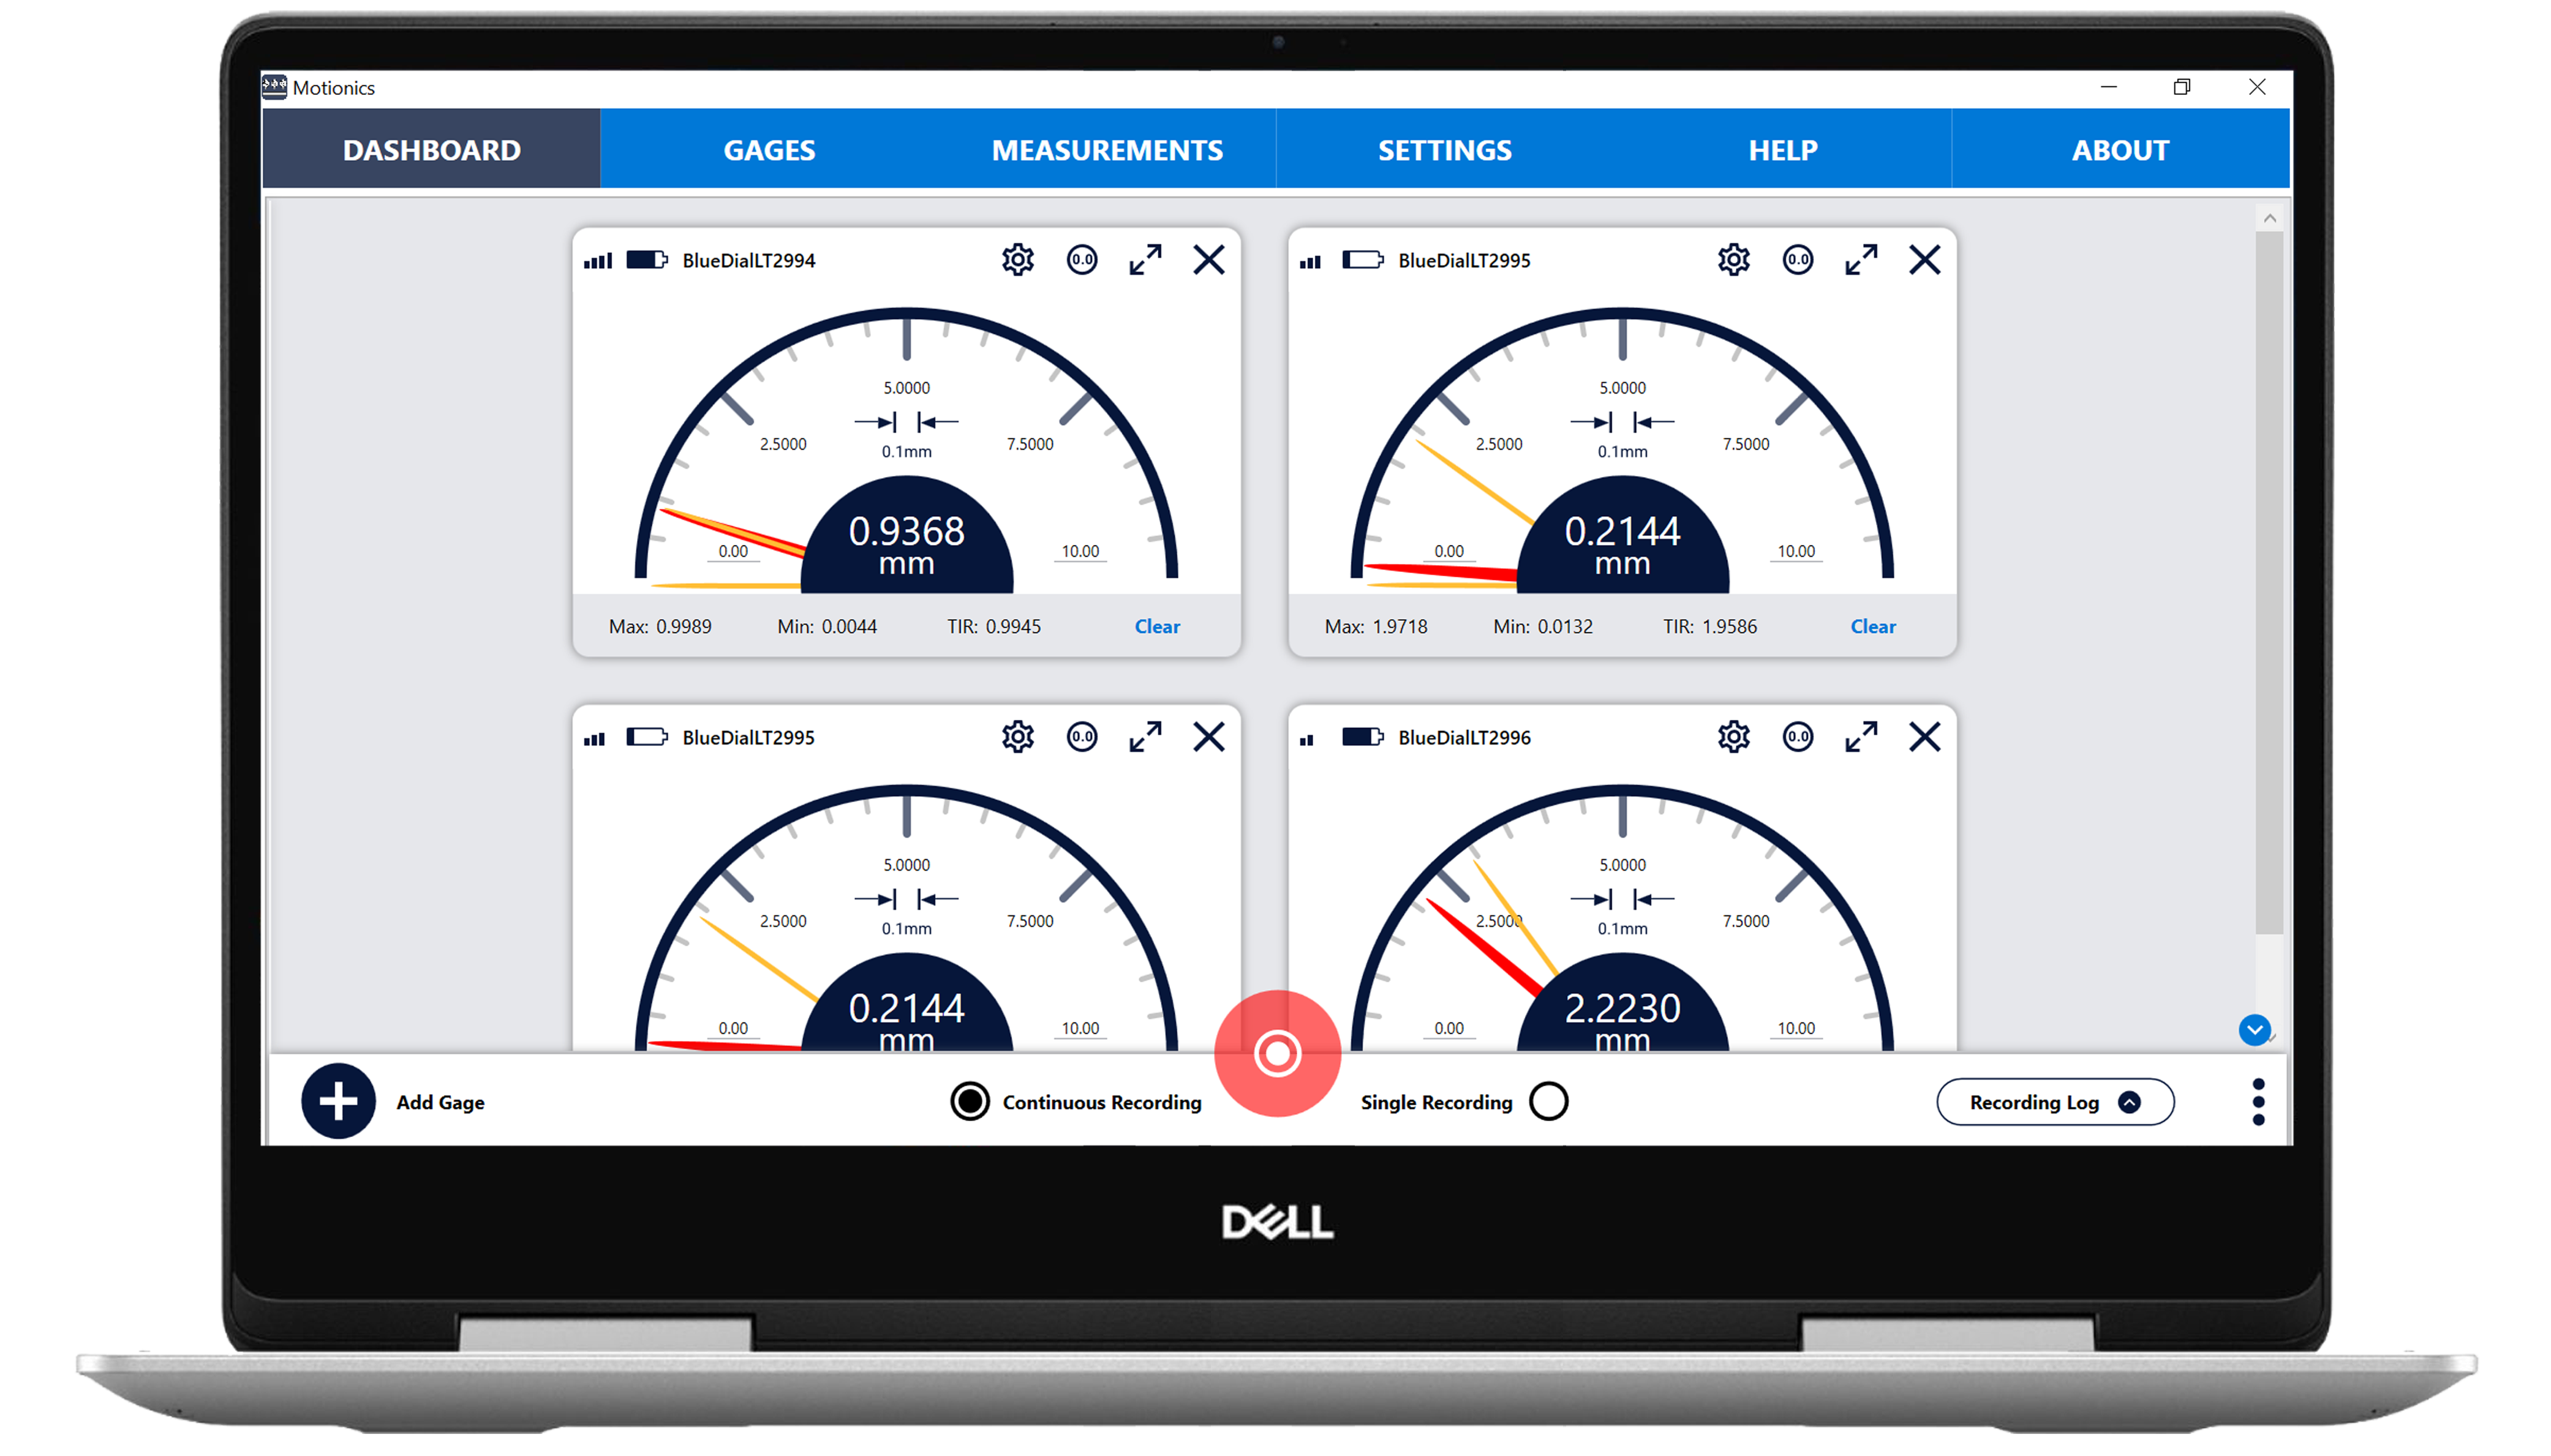
Multiple Device Connectivity
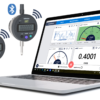
MultiGage Reader for Windows allows you to connect to multiple devices. Each dongle connects to up to 8 wireless devices and can receive readings from all of them at the same time.
Diferent Gage Display Modes
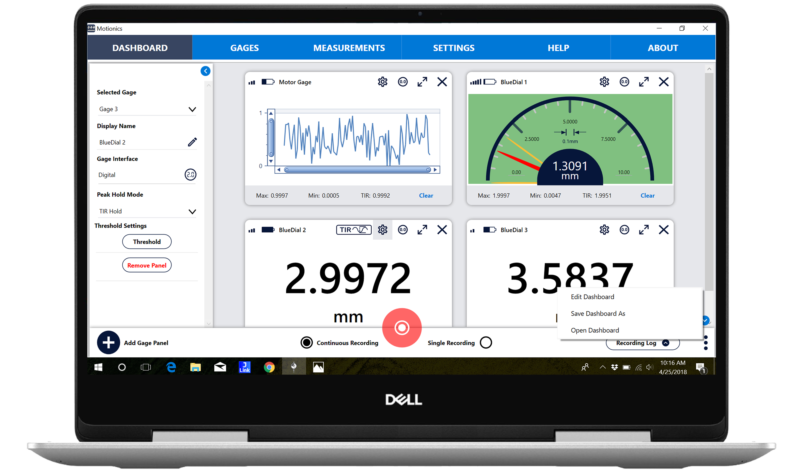
You can change the settings for each gage to switch between digital, analog, and graph modes.
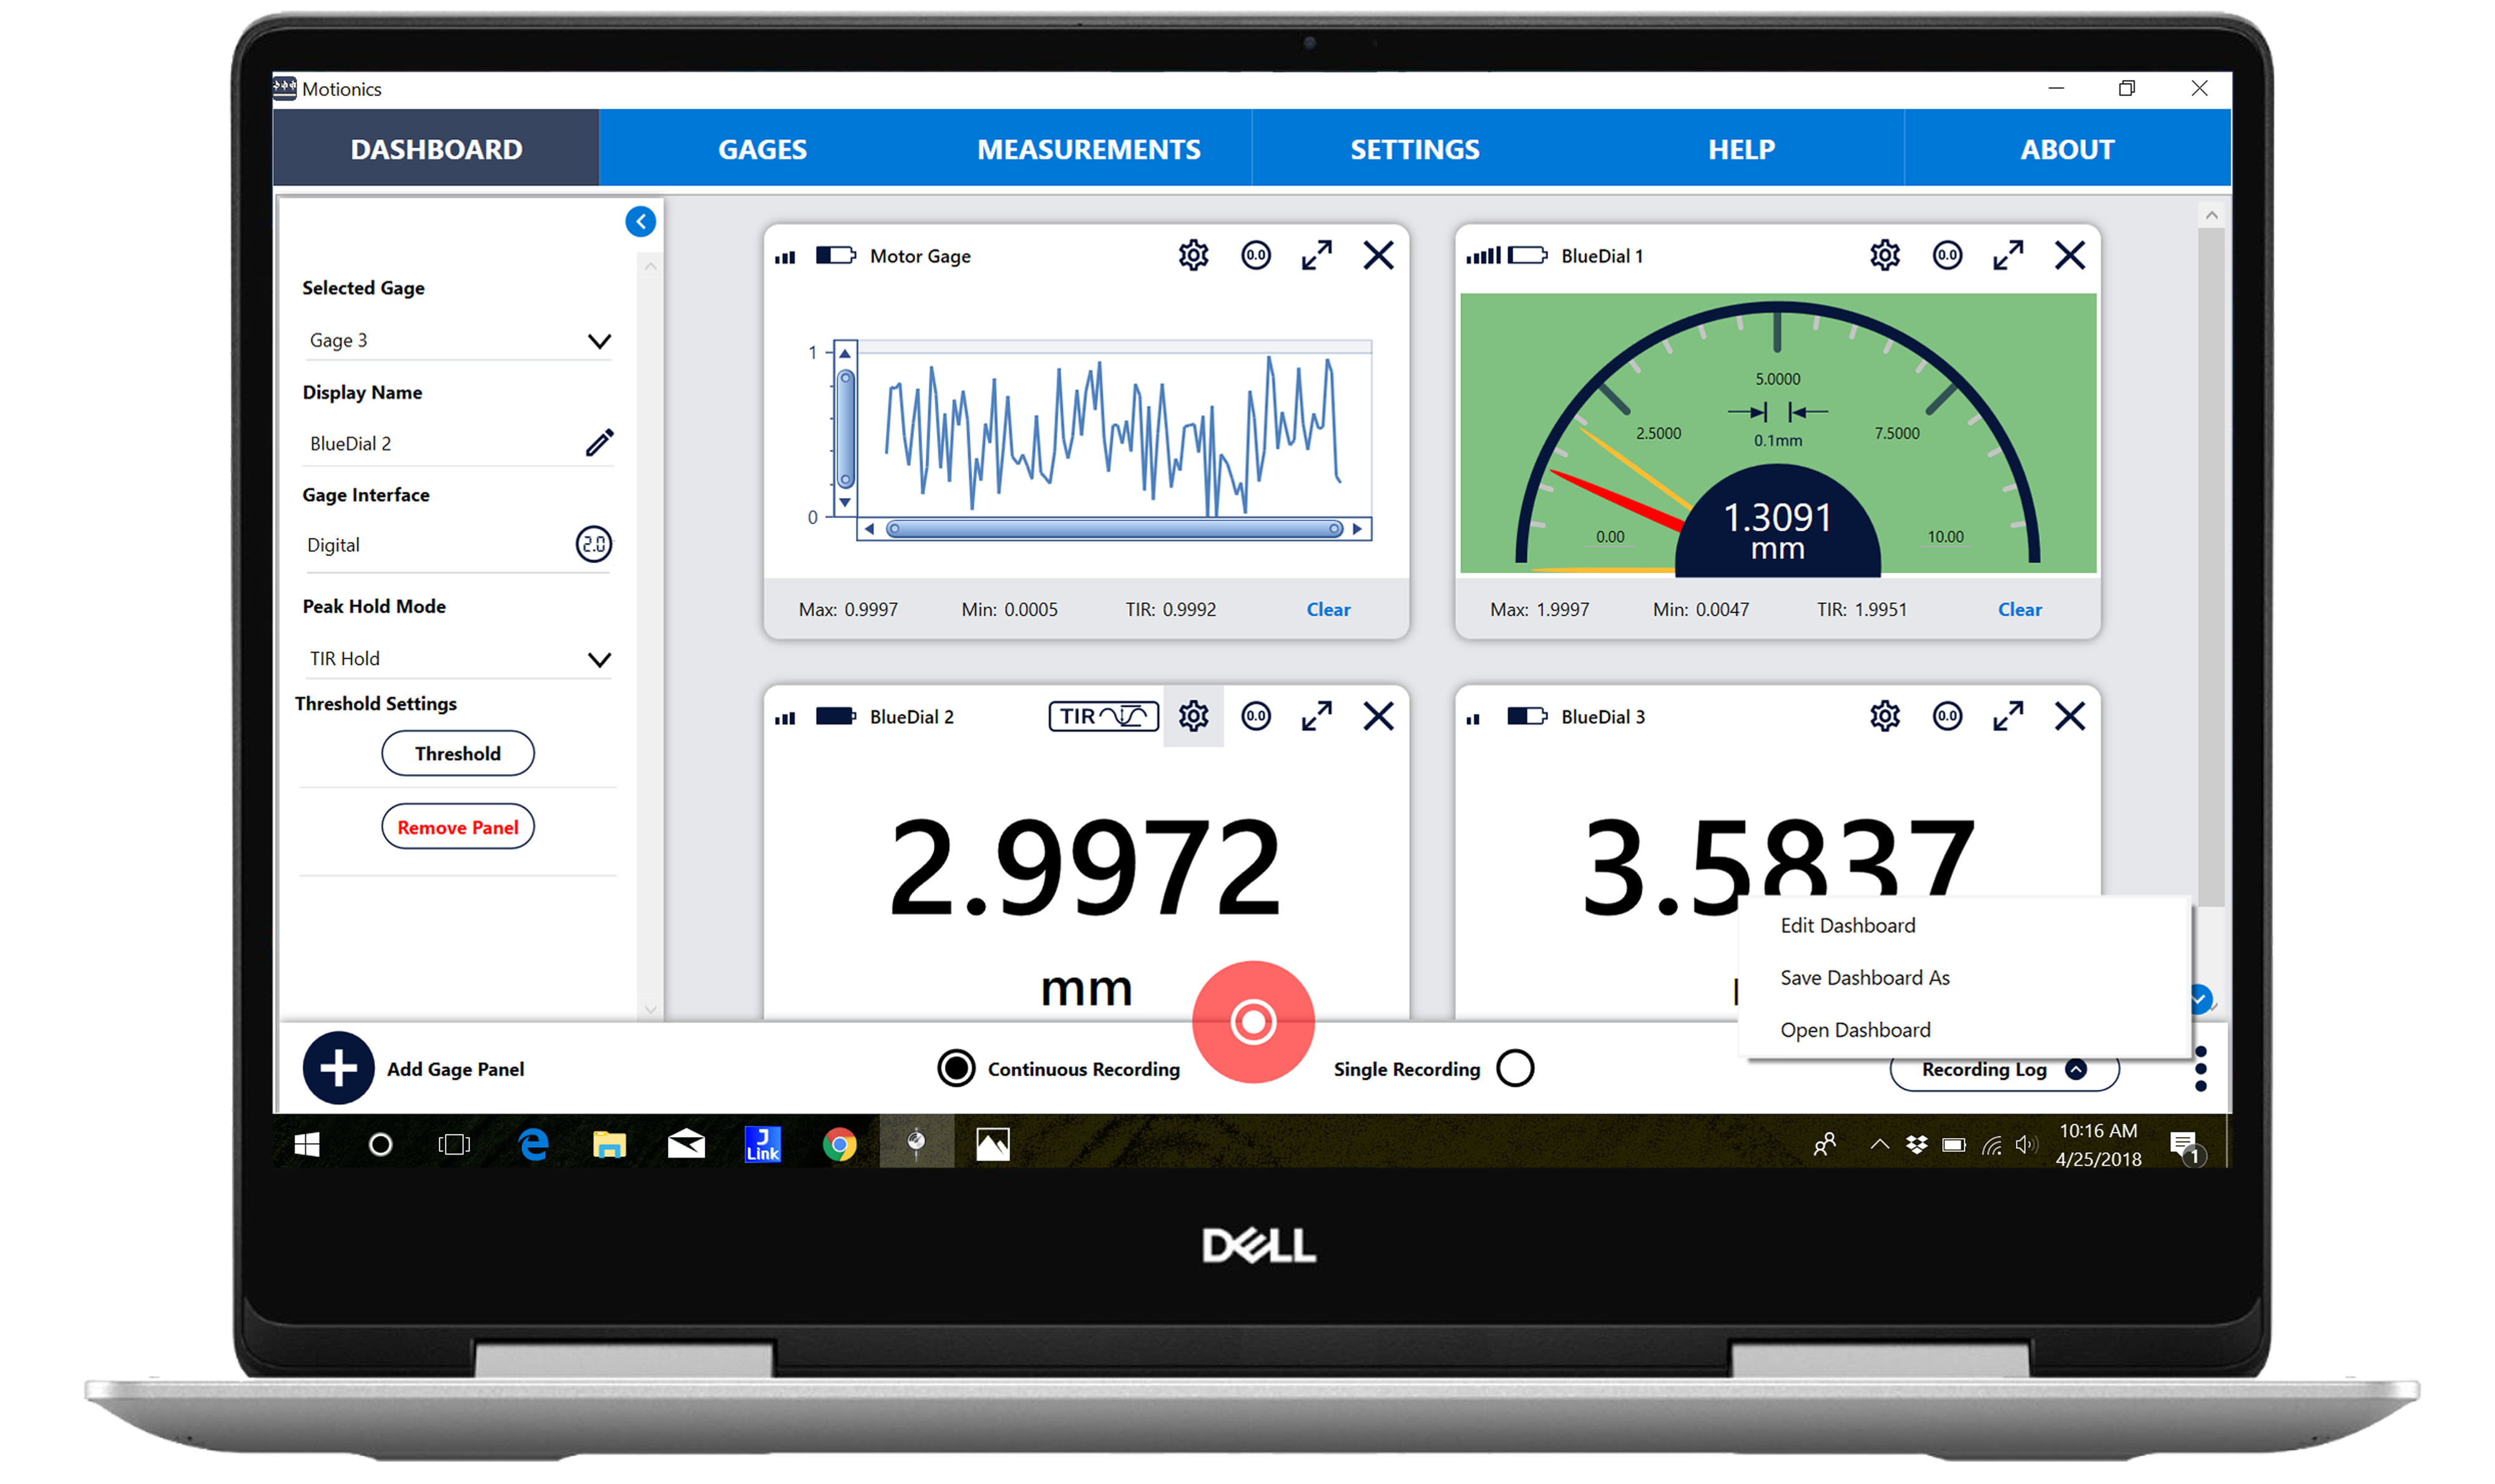
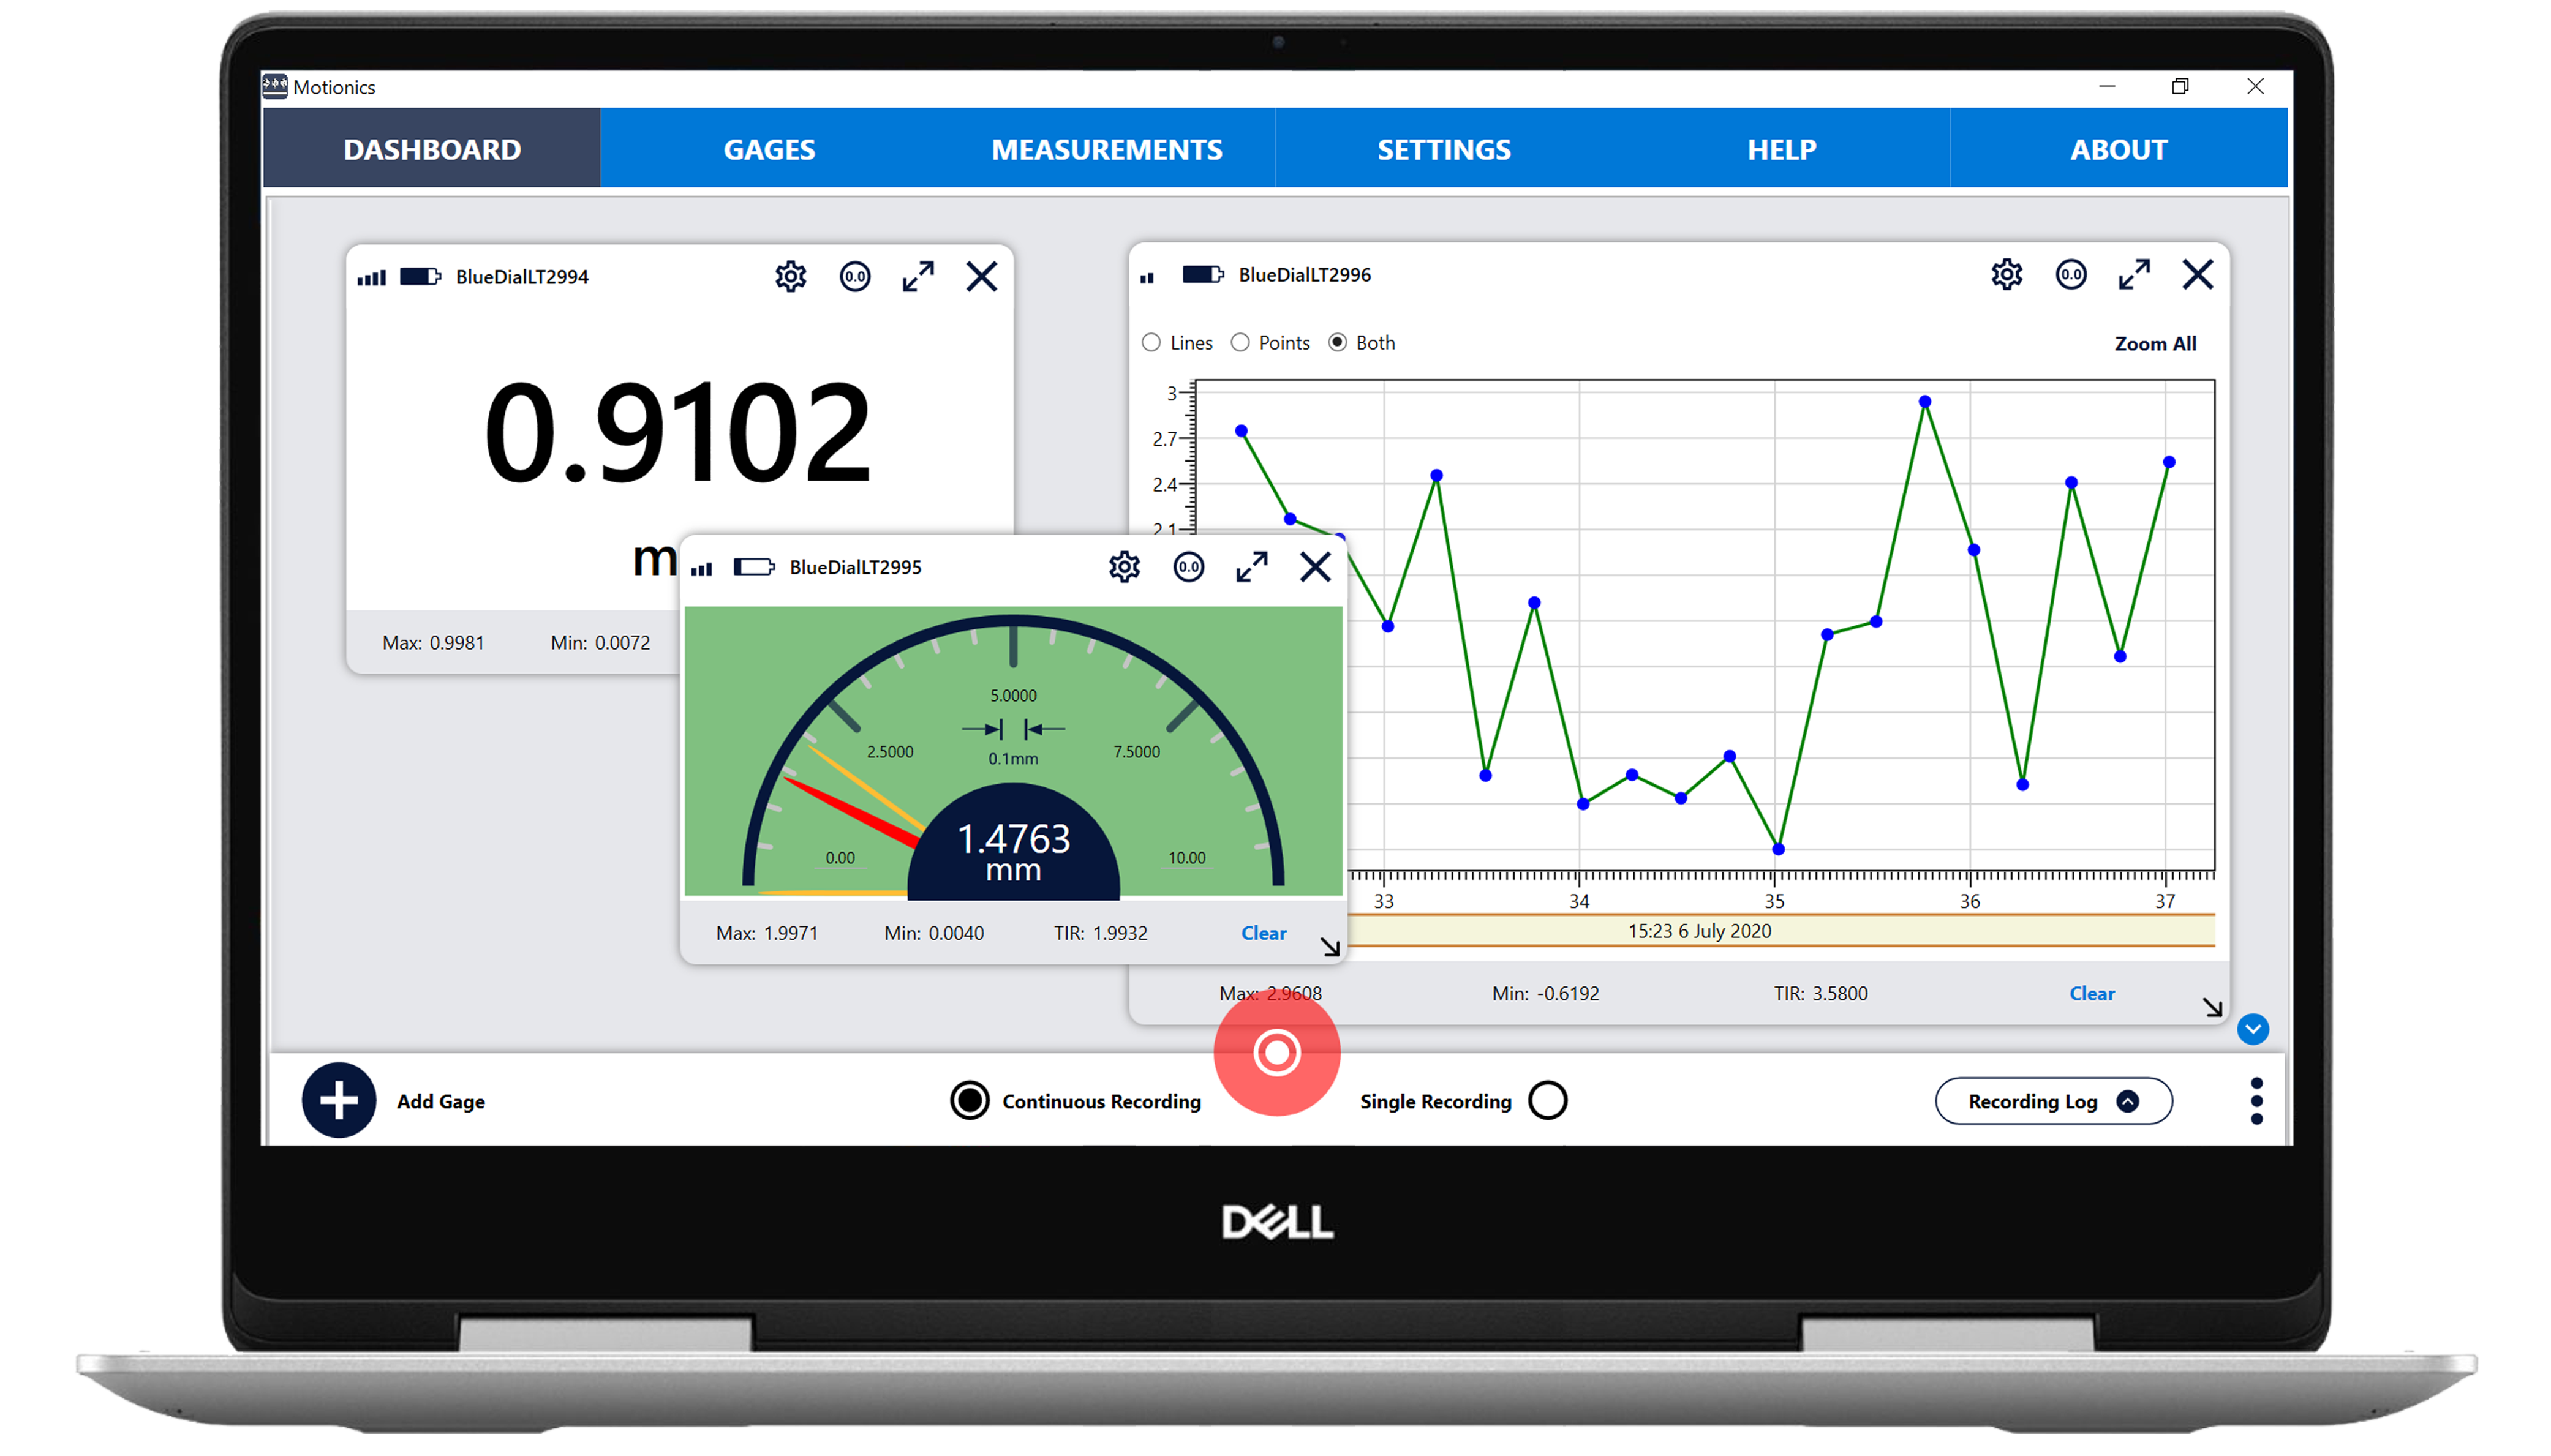
Individual Movable Panels for Each Device
The MultiGage Reader app has an option to connect diferent devices at same time, with each device displayed in a diferent panel so that you can check the readings of all devices in one frame simultaneously.
Custom Gauge Panels
With the addition of our custom gauge panels feature, you can more fully customize your gauge setup. With custom dashboard panels enabled, you can add, move, and resize gauge panels, as well as determine what elements are shown and what the style of those elements are. You can add custom colors, adjust borders, and change the position of gauge panel elements. You can also change the background of your dashboard, so you can integrate diagrams, drawings, machine pictures, and more.
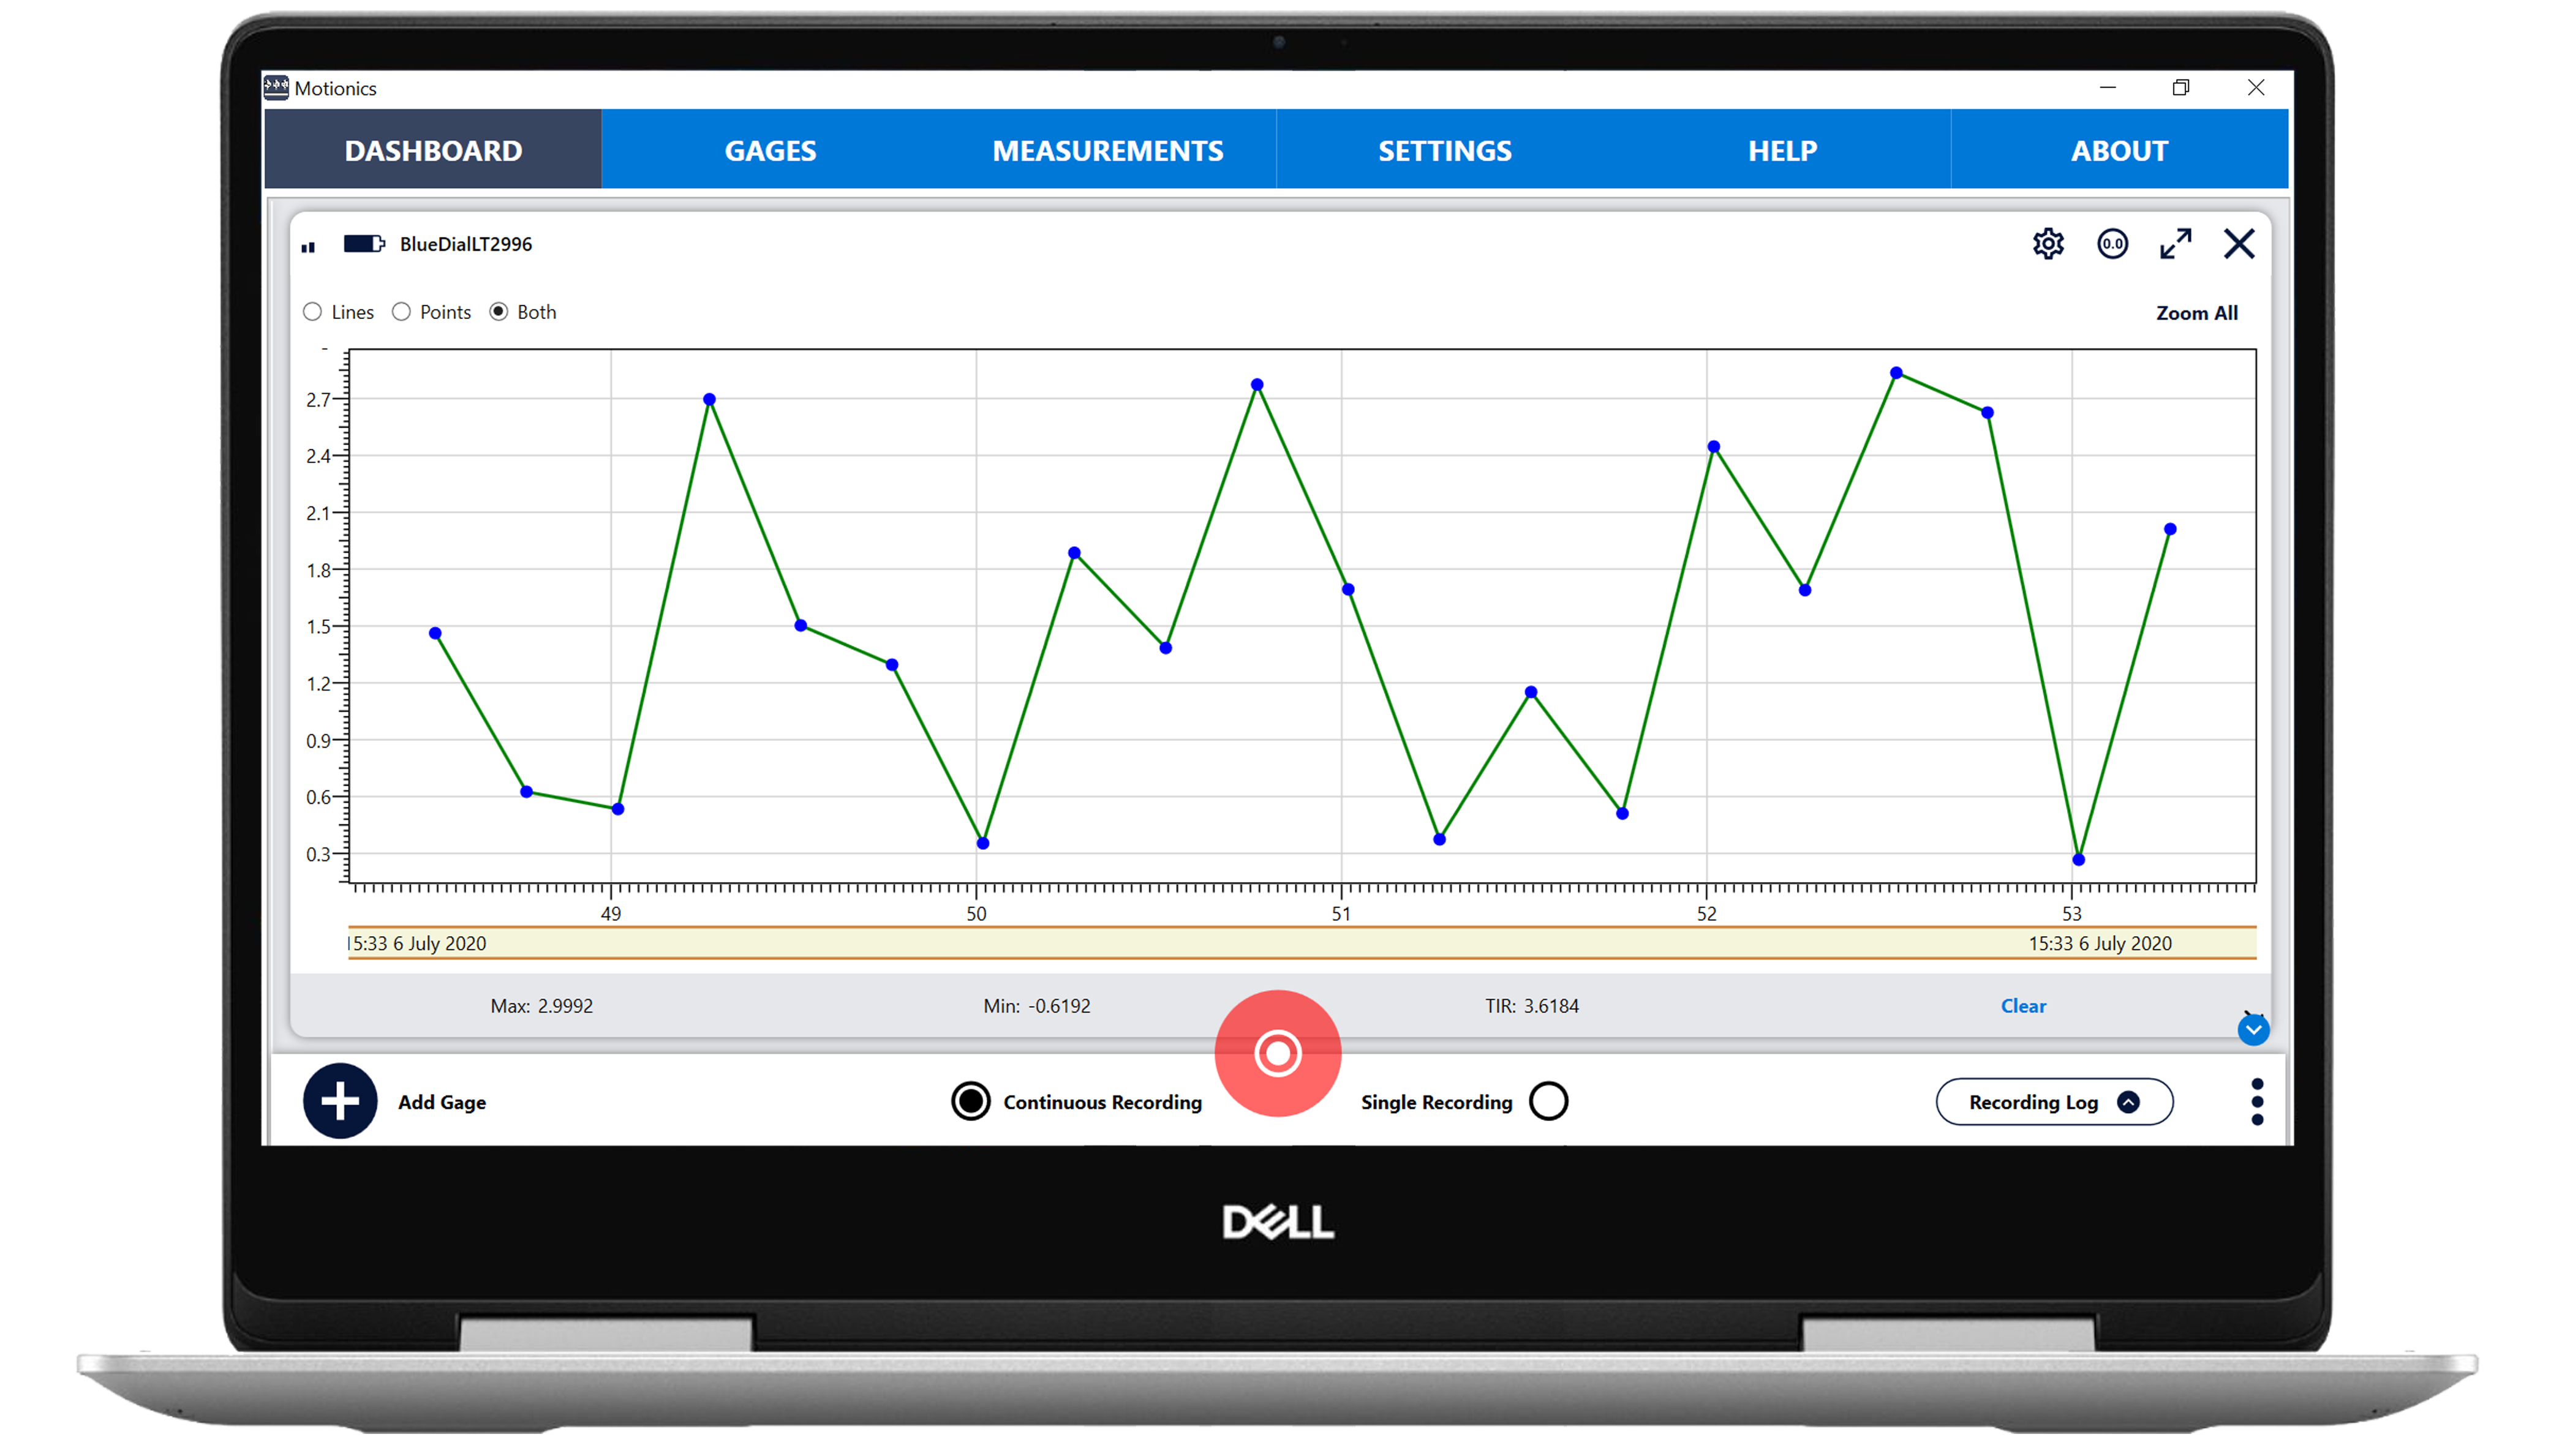
Data Plotting
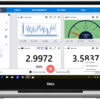
The Data Plot option helps you to show the collected data from the device in graph form. You can zoom in/out the graph and, using the marker option, you can add points on the graph.
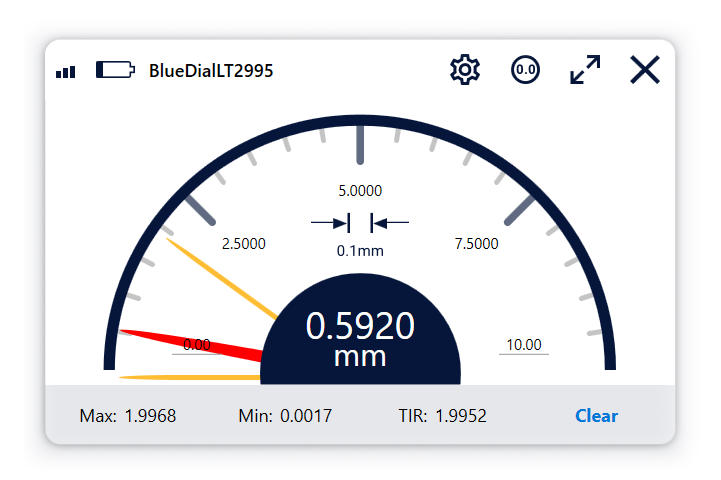
Max, Min, and TIR Display
Each gage panel displays the maximum and minimum values the device has reached. It also allows the user to change the range.
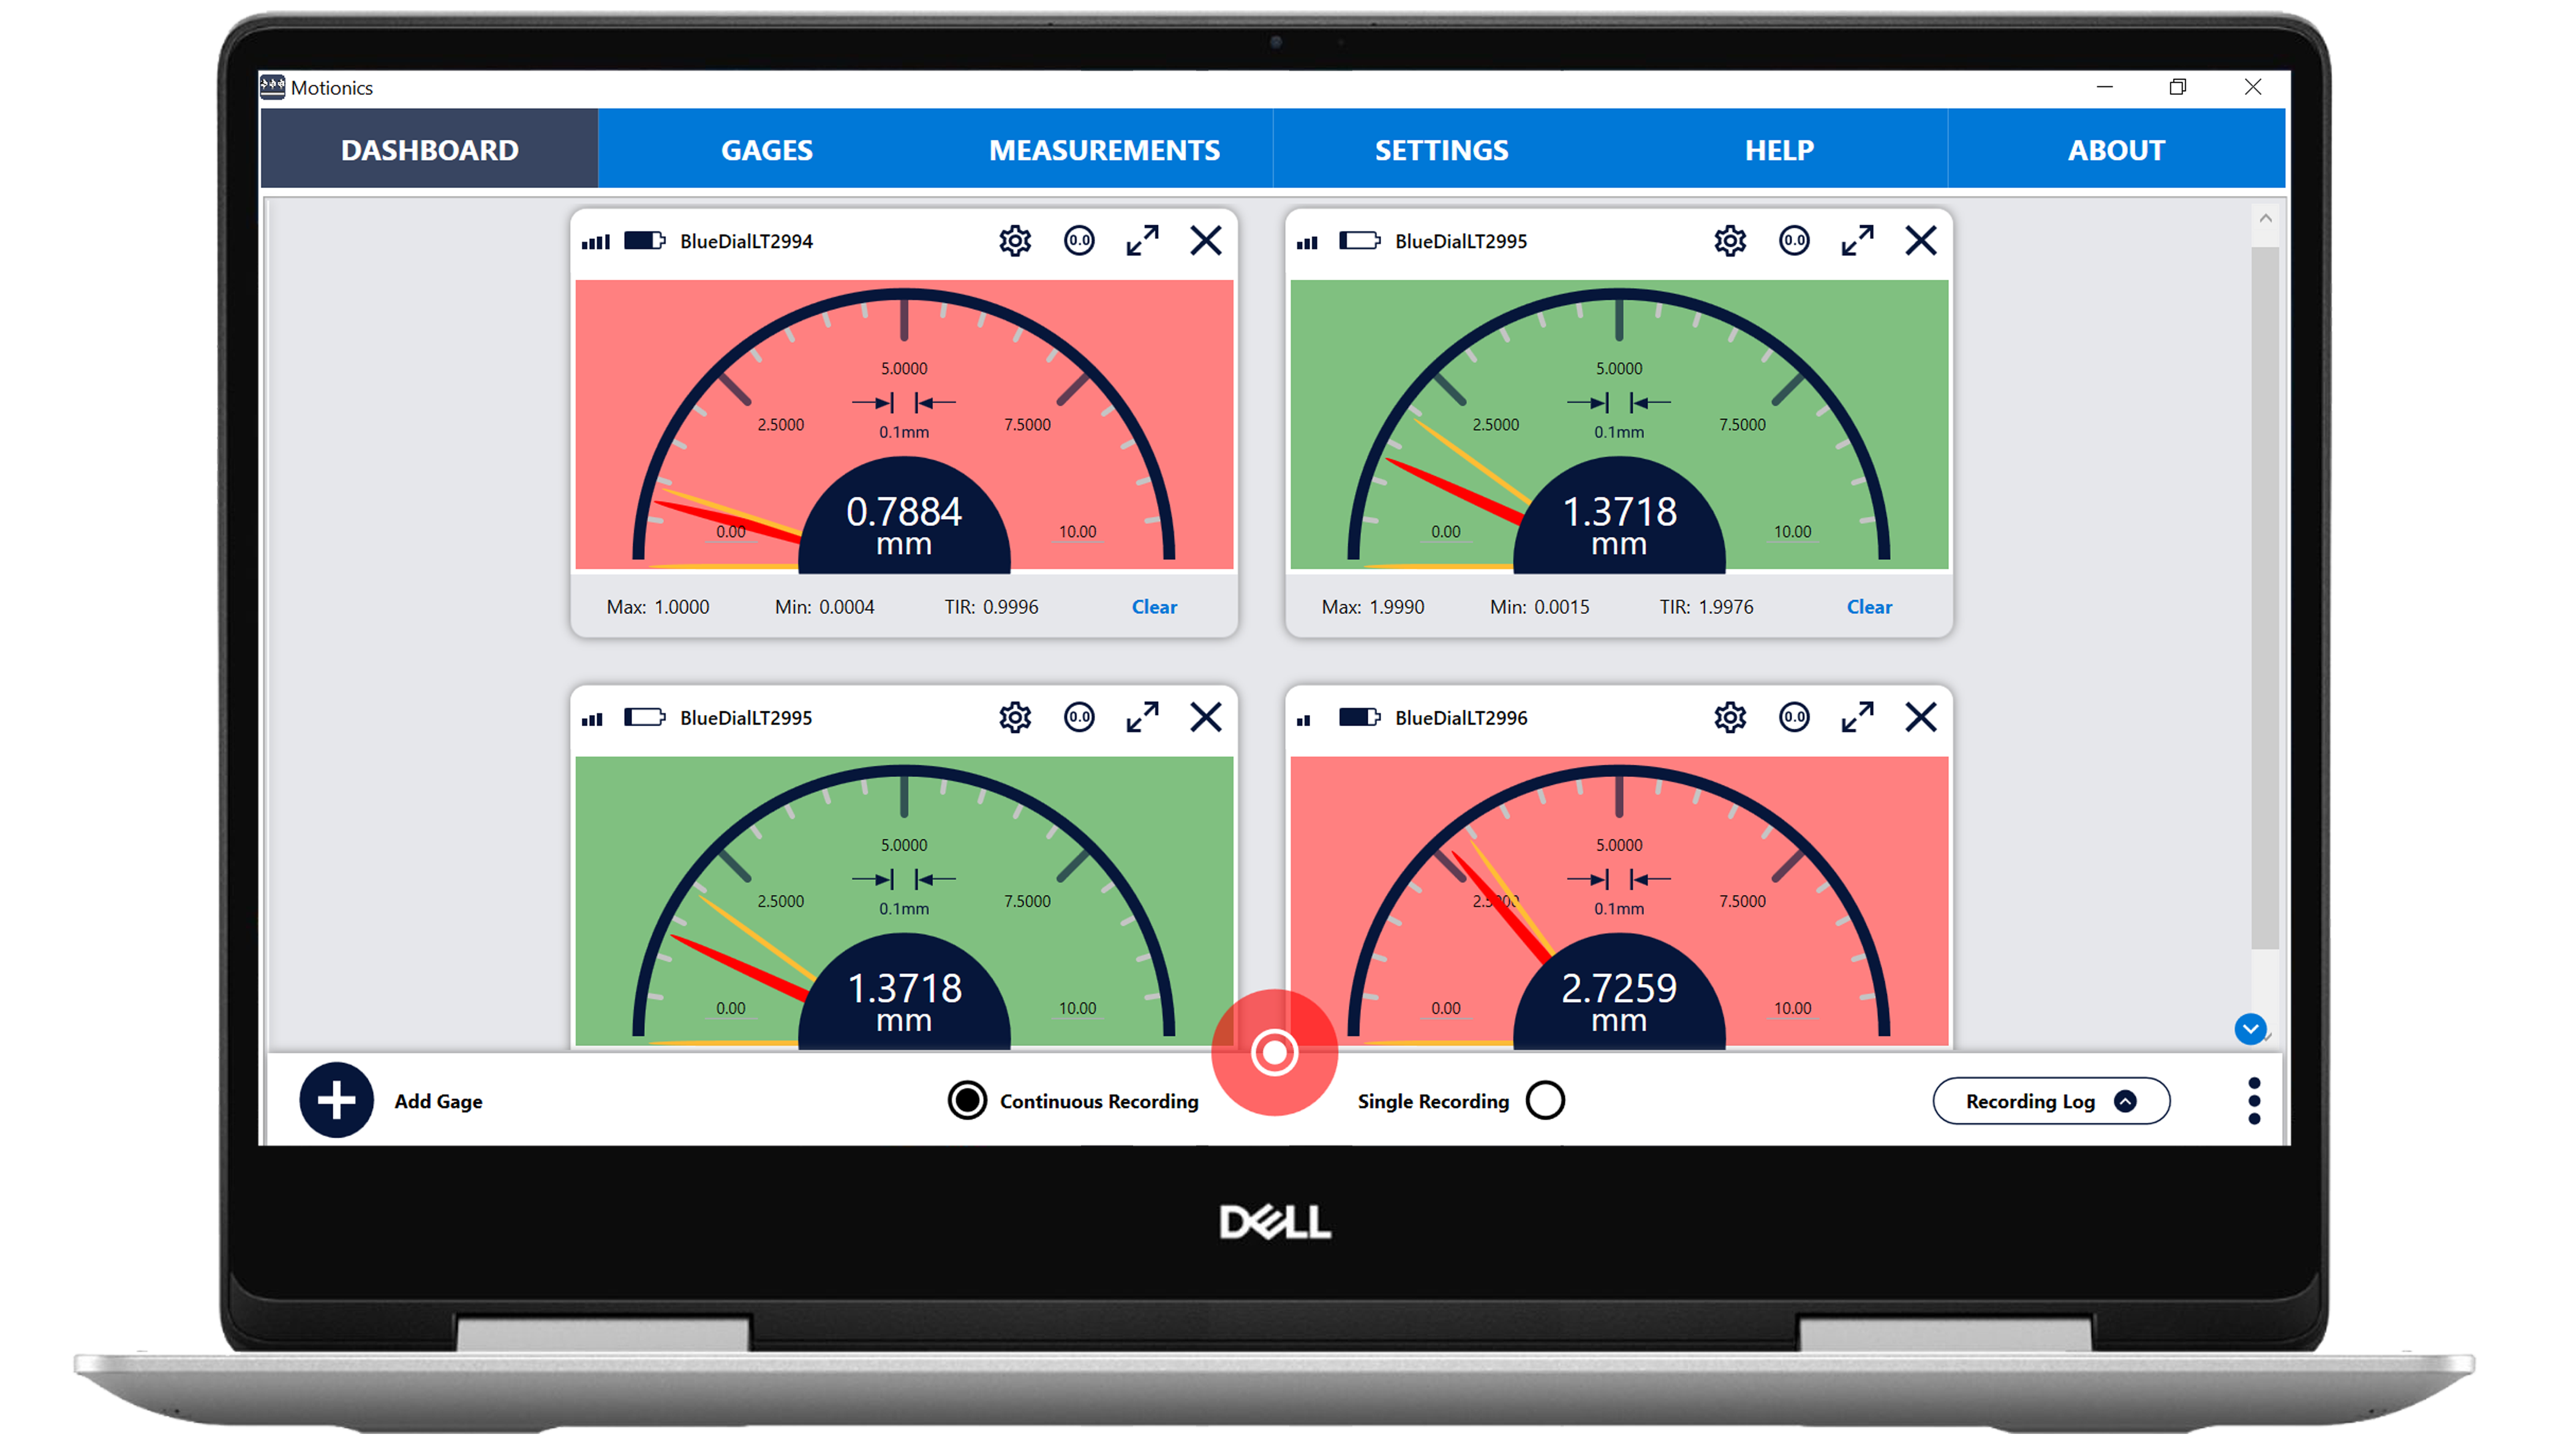
GO/NG Judgment
Motionics’ MultiGage Windows software has Go/No-Go Judgement, allowing the user to set a threshold so the gages can change color to indicate whether the reading is within that range.
Direct Keyboard Input
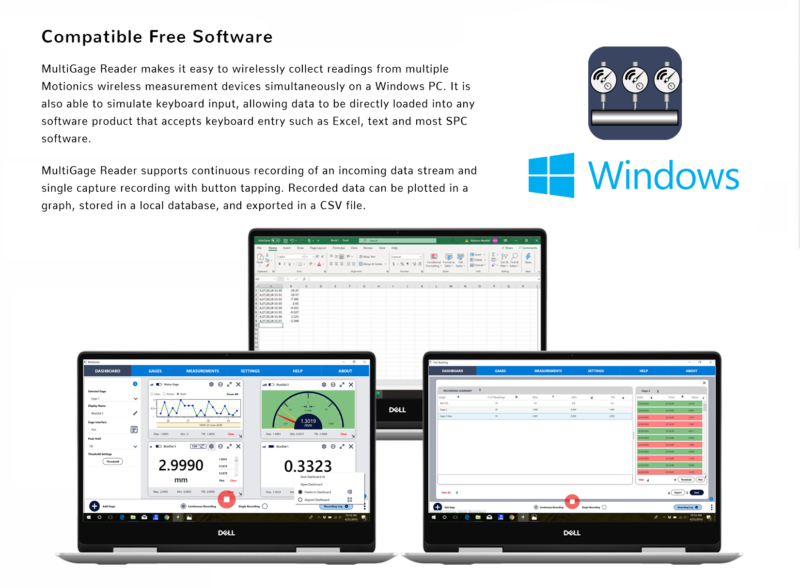
MultiGage Windows can simulate keyboard input, allowing data to be directly loaded onto any software product that accepts keyboard entry, such as Excel, text documents, and most SPC software.
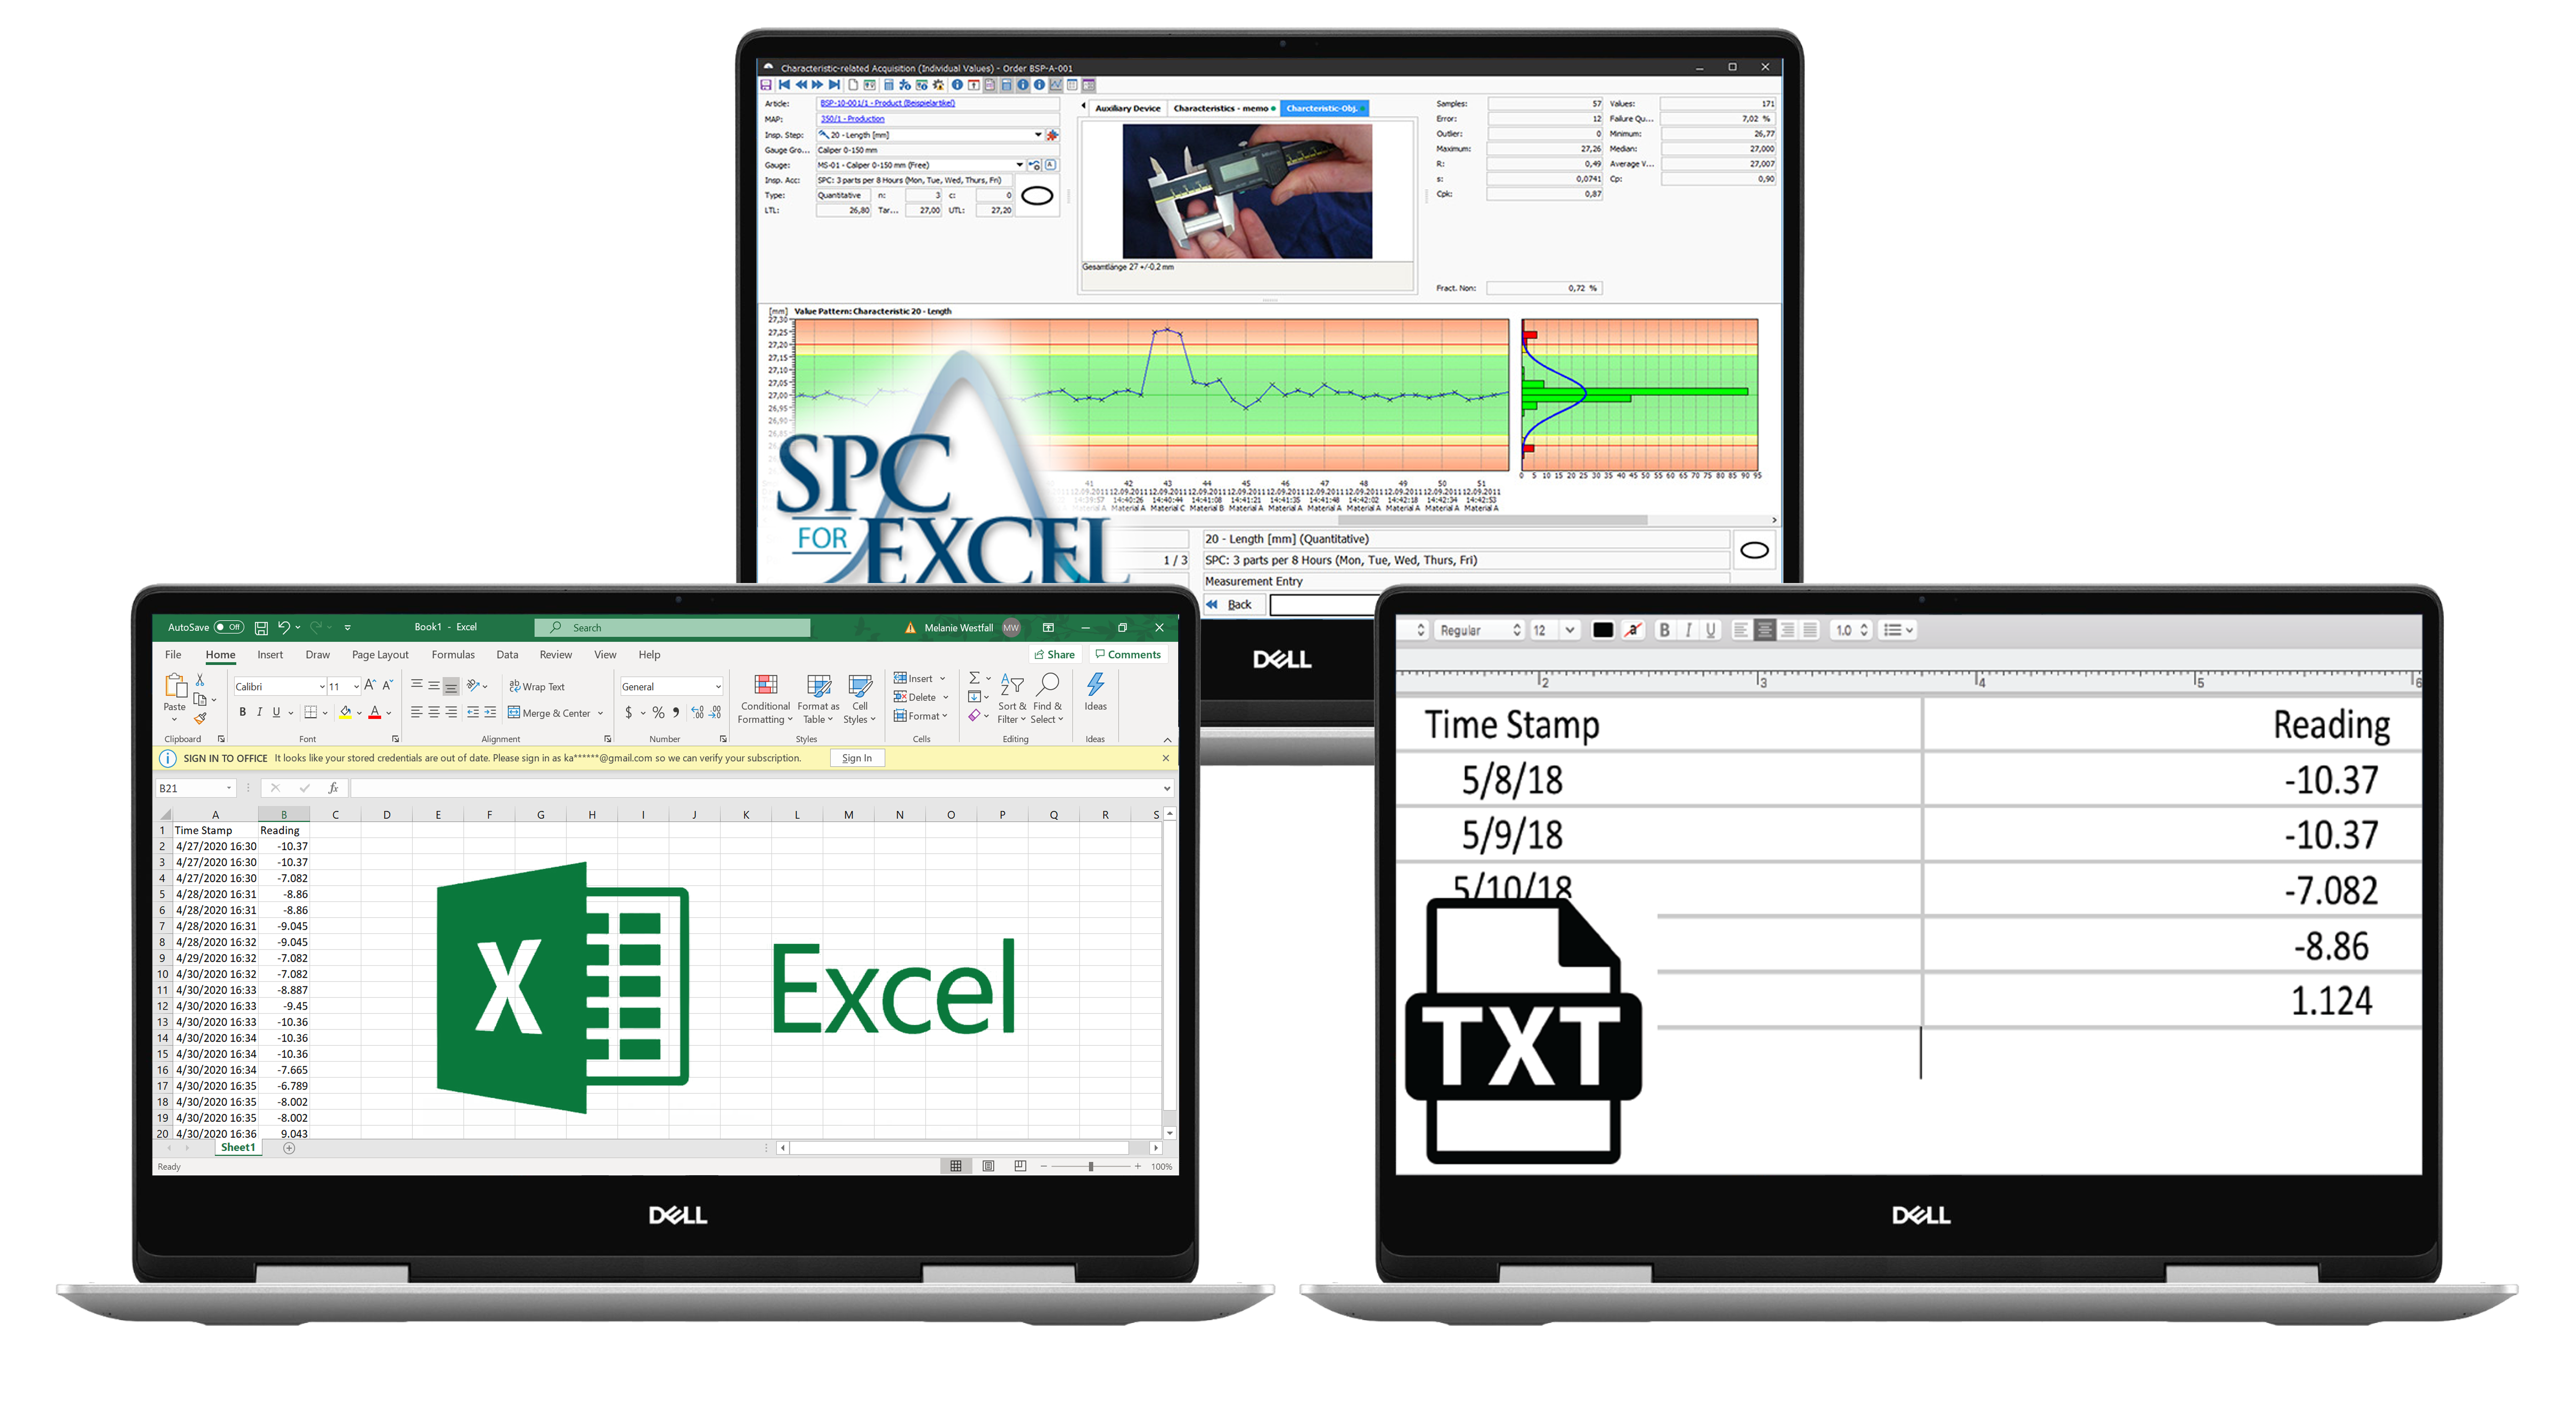
Data Saving and Exporting
Once you’ve finished recording your measurements, you can save the data locally and export it as a CSV.
Reviews
There are no reviews yet.